GDI高级编程

第15章 GDI+高级编程
本章介绍GDI+的路径、区域、变换、图像处理和图元文件等高级编程内容。
路径由许多不同类型的点所构成,用于表示复杂的不规则图形。区域是由矩形、椭圆、多边形等几何形状组合构成的一种封闭图形,可用于复杂图形的绘制、剪裁和击中测试等。Graphics类可对绘制的图形进行平移、旋转和伸缩变换。矩阵类Matrix则可用于图形、图像、颜色、路径、区域等对象的变换。GDI+的图像处理功能强大,可以加载、保存和操作多种格式的图像。GDI+的图元文件格式为EMF+,可用来保存和重放绘图记录,也能用于交互绘图的重绘操作。
15.1 路径
路径(path)是一系列相互连接的直线和曲线,由许多不同类型的点所构成,用于表示复杂的不规则图形,也叫做图形路径(graphics path)。路径可以被画轮廓和填充,也可以用于创建区域和路径渐变刷等。
在GDI中也有路径(本书未讲),但是它只是作为DC的一种状态才能存在。独立的路径对象,则是GDI+的新特点。
15.1.1 图形路径
在GDI+中,路径由图形路径类GraphicsPath表示,它是GDI+基类GdiplusBase的直接派生类。
1.构造函数
GraphicsPath类有三个构造函数:
GraphicsPath(FillMode fillMode = FillModeAlternate); // 构造一个空路径
GraphicsPath(const Point *points, const BYTE *types, INT count, FillMode fillMode = FillModeAlternate); // 构造含指定整数型点数组的路径
GraphicsPath(const PointF *points, const BYTE *types, INT count, FillMode fillMode = FillModeAlternate); // 构造含指定浮数型点数组的路径
其中:
●填充模式参数fillMode在上一章的画填充多边形和曲线时已经讲过,枚举类型
FillMode除了可取这里的默认值FillModeAlternate(交替填充模式)之外,还有一
个可取的值是FillModeWinding(环绕替填充模式)。
●点数组参数points,可以是整数类型的,也可以是浮点数类型的。
●点类型数组参数types,主要点类型有路径起点、直线端点和贝塞尔点。
●计数参数count为数组points和types的元素数,这两种数组中的元素数必须一致。
2.点的种类
构造函数中,点的类型取值为枚举类型PathPointType常量;
typedef enum {
PathPointTypeStart = 0, // 起点
PathPointTypeLine = 1, // 直线端点
PathPointTypeBezier = 3, // 贝塞尔(曲线的控制)点
PathPointTypePathTypeMask = 0x7, // 点类型掩码(只保留低三位)
PathPointTypePathDashMode = 0x10, // 未使用
PathPointTypePathMarker = 0x20, // 标记点(用于路径分段)
PathPointTypeCloseSubpath = 0x80, // 闭子路径(图形)的终点
PathPointTypeBezier3 = 3 // 同PathPointTypeBezier
} PathPointType;
其中,主要的点类型有起点、直线端点、贝塞尔点、标记点和闭子路径终点。其他曲线类型(如弧、椭圆和基样条曲线等)在路径中都是用贝塞尔曲线来表示的。
路径是由点组成的,但这里的点,不光指其坐标位置,还包括点的类型。同样的点坐标,不同的点类型,最后得到的路径可能大相径庭。
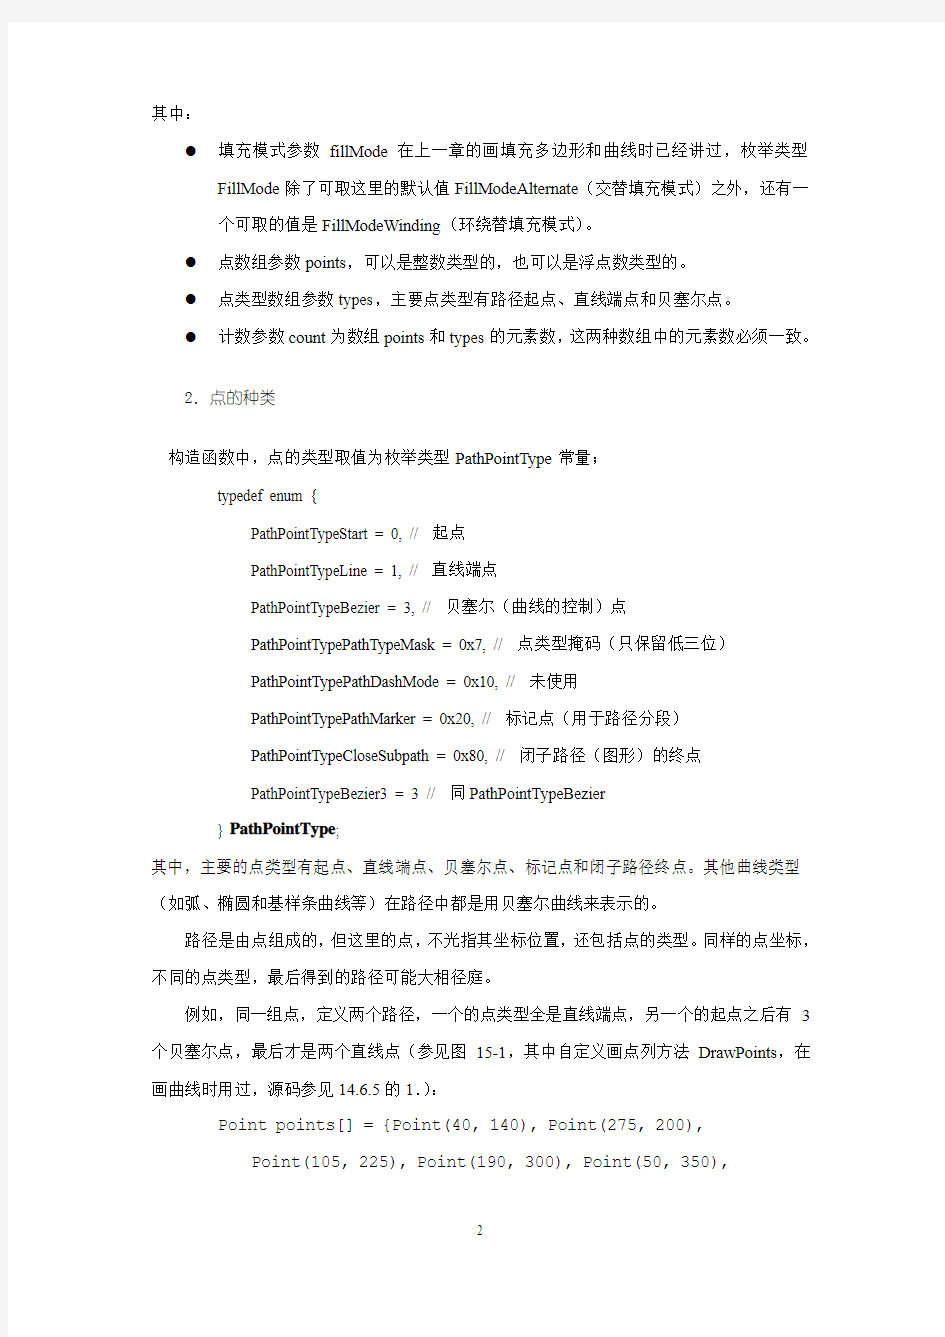
例如,同一组点,定义两个路径,一个的点类型全是直线端点,另一个的起点之后有3个贝塞尔点,最后才是两个直线点(参见图15-1,其中自定义画点列方法DrawPoints,在画曲线时用过,源码参见14.6.5的1.):
Point points[] = {Point(40, 140), Point(275, 200),
Point(105, 225), Point(190, 300), Point(50, 350),
Point(20, 180)}; // 定义点数组
// 定义点类型数组(为了节省篇幅,有些直接用了枚举的整数值)
BYTE lineTypes[] = {PathPointTypeLine, 1, 1, 1, 1, 1};
BYTE types[] = {PathPointTypeStart, PathPointTypeBezier, 3, 3, PathPointTypeLine, 1};
GraphicsPath path1(points, lineTypes, 6), // 创建直线路径
path2(points, types, 6); // 创建复合路径Graphics graph(pDC->m_hDC); // 创建图形对象
// 填充直线路径、画直线、画点列
graph.FillPath(&SolidBrush(Color::Lime), &path1);
graph.DrawLines(&Pen(Color::Violet), points, 6);
DrawPoints(graph, Color::Red, 4, points, 6);
graph.TranslateTransform(300, 0); // 右移300像素
// 填充复合路径、画直线、画点列
graph.FillPath(&SolidBrush(Color::Aqua), &path2);
graph.DrawLines(&Pen(Color::Magenta), points, 6);
DrawPoints(graph, Color::Red, 4, points, 6);
图15-1 点类型
3.路径的构成
前面已经讲过,路径是一系列相互连接的直线和曲线,它们最终都是由有序点列所组成。可以利用GraphicsPath类的后两个构造函数,将点数组直接加入路径中。不过,路径中的直线和曲线等图形,一般是通过调用路径类的若干添加图形方法给加进来的。
每个被加入的图形都可以是一个子路径(subpath)。路径对象,会将被加入图形(包括封闭图形)中的点尾首相接,连成一条完整的路径。
在路径中的图形都是开图形(起点和终点可能是同一个点,例如矩形、椭圆、多边形和闭曲线等),可以调用图形路径类的CloseFigure或CloseAllFigures方法:
Status CloseFigure(VOID); // 关闭当前子路径
Status CloseAllFigures(VOID); // 关闭所有子路径
来显式闭合路径对象中的当前子路径或所有子路径。
例如(参见图15-2):
Graphics graph(pDC->m_hDC); // 创建图形像对象
Pen pen(Color::Blue); // 定义蓝色笔
GraphicsPath path; // 创建路径对象
path.AddLine(10.0f, 50.0f, 200.0f, 50.0f); // 加水平直线
//path.StartFigure(); // 断开两条直线之间的连接(即分成两个子路径)
path.AddLine(60.0f, 10.0f, 60.0f, 80.0f); // 加垂直直线
path.AddEllipse(10, 100, 200, 120); // 加椭圆
path.AddBezier(Point(220, 200), Point(250, 150),
Point(300, 50), Point(400, 200)); // 加贝塞尔曲线int n = path.GetPointCount(); // 获取路径中的点数
Point *points = new Point[n]; // 新建点数组
path.GetPathPoints(points, n); // 获取路径中的点
//path.SetFillMode(FillModeWinding); // 设置填充模式
// 填充(开)路径
//graph.FillPath(&SolidBrush(Color::Aqua), &path);
graph.DrawLines(&Pen(Color::Green), points, n); // 画折线
//path.CloseAllFigures(); // 关闭所有子路径
graph.DrawPath(&pen, &path); // 画路径轮廓
DrawPoints(graph, Color::Red, 4, points, n); // 画路径中的点4.添加图形
图形路径类GraphicsPath中的下列方法,用于添加图形到路径中(重载和参数都与Graphics类中对应的绘图方法相同,但是前缀都改成了Add):
点列与路径
填充(开)路径
开(子)路径
闭(子)路径
图15-2 路径的构成
● 加直线:AddLine ● 加折线:AddLines ● 加多边形:AddPolygon ● 加矩形:AddRectangle ● 加矩形组:AddRectangles ● 加弧:AddArc ● 加饼:AddPie ● 加椭圆:AddEllipse ● 加贝塞尔曲线:AddBezier ● 加相连的多段贝塞尔曲线:
AddBeziers
● 加基样条曲线:AddCurve ● 加闭基样条曲线:AddClosedCurve ● 加串:AddString
5.绘制路径
可以用Graphics 类的方法DrawPath 来画路径的轮廓,用其另一个方法FillPath 来填充路径的内部(对开路径,会先自动封闭,然后再进行填充):
Status DrawPath(const Pen *pen, const GraphicsPath *path); Status FillPath(const Brush *brush, const GraphicsPath *path);
当然你也可以用GraphicsPath 类的方法SetFillMode 和GetFillMode 来设置不同的填充模式或者获取当前的填充模式:
Status SetFillMode(FillMode fillmode);
FillMode GetFillMode(VOID);
关于画路径轮廓和填充路径的例子,前面已经有了很多,这里就不再列举了。
6.获取点信息
在创建路径并添加各种几何图形或字符串之后,我们可以调用如下一些GraphicsPath类
的方法,来获取路径中的点的信息。包括点的坐标信息和点的类型信息:
INT GetPointCount(VOID); // 获取路径中的总点数
Status GetPathPoints(Point *points, INT count); // 获取路径中(指定数目的)整数点数组
Status GetPathPoints(PointF *points, INT count); // 获取路径中(指定数目的)浮点数点数组Status GetPathTypes(BYTE *types, INT count); // 获取路径中(指定数目的)点类型数组例如:
GraphicsPath path;
…… // 添加若干图形到路径
int n = path.GetPointCount();
Point *points = new Point[n];
path.GetPathPoints(points, n);
graph.DrawLines(&Pen(Color::Green), points, n);
DrawPoints(graph, Color::Red, 4, points, n);
15.1.2 路径渐变刷
路径可以表示复杂的图形,可以用于绘制这些图形的轮廓和填充,也可以用于创建区域
(在下一节介绍)和颜色渐变刷。后者在前面美术字部分的彩心字符串例中(参见14.8.3 5.),
我们已经用过。
与其它具体刷(如实心刷、条纹刷和纹理刷等)类一样,路径渐变(梯度)刷类PathGradientBrush,也是Brush类的派生类。它有3个构造函数:
PathGradientBrush(const GraphicsPath *path);
PathGradientBrush(const Point *points, INT count,
WrapMode wrapMode = WrapModeClamp);
PathGradientBrush(const PointF *points, INT count,
WrapMode wrapMode = WrapModeClamp);
第一个构造函数从现有路径对象来创建画刷,后两个则是从整数或浮点数点集来直接创建画刷,而且它们两个还有一个重复排列的输入参数wrapMode,默认值为WrapModeClamp (不重复排列)。
路径刷的颜色,一般是从路径点(周边轮廓)向路径中心渐变。路径刷的默认中心为路径的形心,可以用路径刷方法SetCenterPoint来重新设置:
Status SetCenterPoint(const Point &point);
Status SetCenterPoint(const PointF &point);
其中的中心点,可以位于任何位置,包括在路径的范围之外。对应的获取刷中心的方法是:Status GetCenterPoint(Point *point);
Status GetCenterPoint(PointF *point);
其它常用的路径刷方法有:
Status SetCenterColor(const Color &color); // 设置刷中心颜色
Status SetSurroundColors(const Color *colors, INT *count); // 设置路径点颜色
Status GetCenterColor(Color *color); // 获取刷中心颜色
INT GetSurroundColorCount(VOID); // 获取路径点颜色数目
Status GetSurroundColors(Color *colors, INT *count); // 获取路径点颜色数组
其中,路径刷的中心色和路径点色,默认都为背景色(白色)。
例如(用路径刷画五角星,参见图15-3):
void FillPentacle(HDC hdc) {
INT count = 10;
Point points[] = {Point(100, 0), Point(122, 69),
Point(195, 69), Point(137, 111), Point(159, 181),
Point(100, 138), Point(41, 181), Point(63, 111),
Point(5, 69), Point(78, 69)};
GraphicsPath path;
path.AddPolygon(points, count);
Graphics graph(hdc);
PathGradientBrush pgBrush(&path);
pgBrush.SetCenterColor(Color::Red/*Green*/);
graph.FillPath(&pgBrush, &path);
Color cols[] = {Color::Black, Color::Green, Color::Blue, Color::White, Color::Black, Color::Green, Color::Blue,
Color::White, Color::Black, Color::Green};
/*Color cols[] = {Color::Cyan, Color::Aqua, Color::Blue, Color::Chartreuse, Color::Coral, Color::CadetBlue,
Color::HotPink, Color::Turquoise, Color::LightSkyBlue,
Color::DeepPink};
pgBrush.SetCenterColor(Color::White);*/
pgBrush.SetSurroundColors(cols, &count);
graph.TranslateTransform(200.0f, 0);
graph.FillPath(&pgBrush, &path);
for (int i = 0; i < count; i++)
cols[i] = Color(rand() % 255, rand() % 255, rand() % 255);
pgBrush.SetSurroundColors(cols, &count);
pgBrush.SetCenterColor(Color(rand() % 255, rand() % 255,
rand() % 255));
graph.TranslateTransform(-200.0f, 200.0f);
graph.FillPath(&pgBrush, &path);
for (int i = 0; i < count; i++)
cols[i] = Color(rand() % 255, rand() % 255, rand() % 255);
pgBrush.SetSurroundColors(cols, &count);
pgBrush.SetCenterColor(Color(rand() % 255, rand() % 255,
rand() % 255));
graph.TranslateTransform(200.0f, 0.0f);
graph.FillPath(&pgBrush, &path);
}
输出结果为(由于下排的两个五角星,使用的是随机色,所以每次刷新时,颜色都不一样)
a) b)
图15-3 路径刷五角星
a)上排左为红心和白边点,上排右为红心和和黑、绿、蓝、白边点
b) 上排的左右皆为绿心,边点色同a)的
a)和b)下排的中心点和边点都为随机色,刷新后颜色会变
如果将边点全改成红色、绿色或蓝色,中心改为白色,则输出效果如图15-4所示。
图15-4 路径刷五角星(白心,红、绿、蓝边)
又例如(用路径刷画平铺六边形,参见图15-5和图15-6):
#include
……
void FillHexagon(HDC hdc, RectF &rect) // 用路径刷画平铺六边形{
float radian = 3.1415926f / 180.0f;
float l = 50.0f, fh = l * sin(60.0f * radian);
PointF pts[] = {PointF(50.0f, 0.0f),
PointF(50.0f * 1.5f, 0.0f), PointF(50.0f, 0.0f),
PointF(50.0f / 2.0f, -fh), PointF(-50.0f / 2.0f, -fh),
PointF(-50.0f, 0.0f), PointF(-50.0f * 1.5f, 0.0f),
PointF(-50.0f, 0.0f), PointF(-50.0f / 2.0f, fh),
PointF(50.0f / 2.0f, fh)};
PathGradientBrush pgBrush(pts, 10); pgBrush.SetWrapMode (WrapModeTile); Graphics graph(hdc);
pgBrush.SetCenterColor (Color::Red);
graph.FillRectangle(&pgBrush , rect); graph.TranslateTransform(75.0f, fh); pgBrush.SetCenterColor(Color::Green);
graph.FillRectangle(&pgBrush, -75.0f, -fh, rect.Width,
rect.Height);
}
void CGdipDrawView::OnDraw(CDC* pDC) { ……
RECT srect;
GetClientRect(&srect);
RectF rect(0.0f, 0.0f, REAL(srect.right),
REAL(srect.bottom));
FillHexagon(pDC->m_hDC, rect); // 用路径刷画平铺六边形
}
图15-6 路径刷平铺六边形
图15-5 六边形坐标
15.2 区域
区域(region)由若干几何形状所构成的一种封闭图形,主要用于复杂图形的绘制、图形输出的剪裁和鼠标击中的测试等。最简单也是最常用的区域是矩形,其次是椭圆和多边形以及它们的组合。这些也正是GDI所支持的区域类型。
GDI+中的区域是一种显示表面的范围(an area of the display surface),可以是任意形状(的图形的组合),边界一般为路径。除了上面所讲的矩形、椭圆、多边形之外,其边界还可以含直线、折线、弧、贝塞尔曲线和基样条曲线等开图形,其内容还可以包含饼、闭贝塞尔曲线和基样条曲线等闭图形。
在GDI+中,区域所对应的类是Region,它是一个独立的类(没有基类,也没有派生类)。但是它有若干相关的类,如各种图形类和图形路径类等。
15.2.1 构造函数
Region类有6个构造函数:
Region(VOID); // 创建一个空区域
Region(const Rect &rect); // 创建一个整数型矩形区域
Region(const RectF &rect); // 创建一个浮点数型矩形区域
Region(const GraphicsPath *path); // 由图形路径来创建区域
Region(const BYTE *regionData, INT size); // 由(另一)区域的数据构造区域
Region(HRGN hRgn); // 由GDI的区域句柄构造区域
其中,创建矩形区域最简单,由路径创建区域最常用。
15.2.2 其他方法
区域类的其他方法有:
Region *Clone(VOID); // 克隆(复制)
// 判断本区域是否与另一区域region相等,g用于坐标计算:
BOOL Equals(const Region *region, const Graphics *g) const;
BOOL IsEmpty(const Graphics *g) const; // 判断区域是否为空(g也用于坐标计算)
Status MakeEmpty(VOID); // 清空区域
BOOL IsInfinite(const Graphics *g) const; // 判断区域是否无限(g也用于坐标计算)Status MakeInfinite(VOID); // 使区域成为无限的
Status GetBounds(Rect *rect, const Graphics *g) const; //获取外接(包)矩形
Status GetBounds(RectF *rect, const Graphics *g) const; // g也用于坐标计算
UINT GetDataSize(VOID) const; // 获取区域数据的字节大小
// 获取区域的二进制数据,可以用于创建其他区域:
Status GetData(BYTE *buffer, UINT bufferSize, UINT *sizeFilled = NULL) const;
UINT GetRegionScansCount(const Matrix *matrix) const; // 获取区域的矩形逼近表示
Status GetRegionScans(const Matrix *matrix, Rect *rects, INT *count) const;
Status GetRegionScans(const Matrix *matrix, RectF *rects, INT *count) const;
Status Translate(INT dx, INT dy); // 平移区域
Status Translate(REAL dx, REAL dy);
Status Transform(const Matrix *matrix); // 变换区域
Status GetLastStatus(VOID); // 获取最后一次区域操作的状态,成功返回Ok
HRGN GetHRGN(const Graphics *g) const; // 获取区域所对应的GDI区域的句柄
// g也用于坐标计算
区域类还有集合运算和区域测试等方法,将在下面分别介绍。
15.2.3 区域的集合运算
●并(union)
Status Union(const Region *region); // 与另一区域的并
Status Union(const Rect[F] &rect); // 与另一整数[浮点数]型矩形的并
Status Union(const GraphicsPath *path); // 与另一路径的并
●交(intersect):Status Intersect(重载和参数同并的);
●余(exclude):Status Exclude(重载和参数同并的);
●补(complement):Status Complement(重载和参数同并的);
●异或(xor):Status Xor(重载和参数同并的);
例如(参见图15-7):
SolidBrush textBrush(Color::Black);
Font font(L"宋体", 10.5);
StringFormat stringFormat;
stringFormat.SetAlignment(StringAlignmentCenter);
Point points[] = {Point(100, 0), Point(122, 69), Point(195, 69), Point(137, 111), Point(159, 181),
Point(100, 138), Point(41, 181), Point(63, 111),
Point(5, 69), Point(78, 69)};
GraphicsPath path;
path.AddPolygon(points, 10);
Region *pRgn, rgnRect(Rect(0, 50, 200, 80));
SolidBrush *pBrush, gbrush(Color::Green),
tbrush(Color::Turquoise);
CString strs[] = {L"原集", L"并集", L"交集", L"余集", L"补集", L"异或集"};
PointF pts[] = {PointF(0.0f, 0.0f), PointF(210.0f, 0.0f), PointF(210.0f, 0.0f), PointF(-420.0f, 220.0f),
PointF(210.0f, 0.0f), PointF(210.0f, 0.0f)};
Graphics graph(pDC->m_hDC);
for (int i = 0; i < 6; i++) {
pRgn = new Region(&path);
switch (i) {
case 1: pRgn->Union(&rgnRect); break;
case 2: pRgn->Intersect(&rgnRect); break;
case 3: pRgn->Exclude(&rgnRect); break;
case 4: pRgn->Complement(&rgnRect); break;
case 5: pRgn->Xor(&rgnRect); break;
}
if (i == 0) pBrush = &gbrush; else pBrush = &tbrush;
graph.TranslateTransform(pts[i].X, pts[i].Y);
graph.FillRegion(pBrush, pRgn);
if (i == 0) graph.FillRegion(
&SolidBrush (Color(128, 255, 0, 0)), &rgnRect);
graph.DrawString(strs[i], -1, &font, PointF(100, 190), &stringFormat, &textBrush);
delete pRgn;
}
图15-7 区域的集合运算
又例如(抠图,参见图15-8。注意:图像不能太大,背景必须为单色):Bitmap bmp(L"米老鼠和唐老鸭.bmp");
Graphics graph(pDC->m_hDC);
graph.DrawImage(&bmp, 0, 0);
int w = bmp.GetWidth(), h = bmp.GetHeight();
Region rgn(Rect(0, 0, w, h));
Color col, col0;
bmp.GetPixel(0, 0, &col0); // 获取背景色
ARGB argb0 = col0.GetValue();
for (int i = 0; i < w; i++) {
for (int j = 0; j < h; j++) {
bmp.GetPixel(i, j, &col);
if (col.GetValue() == argb0) {
Region pixelRgn(Rect(i, j, 1, 1)); // 单像素矩形
rgn.Exclude(&pixelRgn); // 挖去
}
}
}
graph.TranslateTransform(REAL(w), 0.0f);
graph.FillRegion(&SolidBrush(Color::Green), &rgn); // 容易溢出
图15-8 抠图
为了防止调用FillRegion方法造成堆栈溢出,必须减少区域的复杂度。解决办法之一是,不再每次去一个点,而是一次去一个(垂)直线段,则复杂度会减少一到两个数量级。从而可以避免溢出,代码读者可以自己去写。
15.2.4 击中测试
区域类的下列方法用于复杂图形的击中测试:
// 点是否在区域内(g也用于坐标计算)
BOOL IsVisible(INT x, INT y, const Graphics *g) const; // 整数点坐标
BOOL IsVisible(const Point &point, const Graphics *g) const; // 整数点
BOOL IsVisible(REAL x, REAL y, const Graphics *g) const; // 浮点数点坐标
BOOL IsVisible(const PointF &point, const Graphics *g) const; // 浮点数点
// 矩形是否在区域内(g也用于坐标计算)
// 整数左上角坐标与高宽
BOOL IsVisible(INT x, INT y, INT width, INT height, const Graphics *g) const;
BOOL IsVisible(const Rect &rect, const Graphics *g) const; // 整数矩阵
// 浮点数左上角坐标与高宽
BOOL IsVisible(REAL x, REAL y, REAL width, REAL height, const Graphics *g) const;
BOOL IsVisible(const RectF &rect, const Graphics *g) const; // 浮点矩阵例如,可由前面所讲的文字路径(空心字符串)来构造文字区域,并进行鼠标点是否区域内的测试。代码如下(参见图15-9):
// 在视图类中定义区域指针类变量
class CGdipDrawView : public CView {
……
Region *pRgn;
}
// 在视图类的初始化函数中,创建字符串路径和区域
void CGdipDrawView::OnInitialUpdate() {
CView::OnInitialUpdate();
FontFamily ff(L"隶书");
GraphicsPath path;
path.AddString(L"文字区域", -1, &ff, FontStyleRegular, 150, Point(0, 0), NULL);
pRgn = new Region(&path);
}
// 在视图类的OnDraw函数中绘制
void CGdipDrawView::OnDraw(CDC* pDC) {
……
Graphics graph(pDC->m_hDC);
graph.FillRegion(&SolidBrush(Color::Green), pRgn);
}
// 在视图类的左鼠标键松开的消息响应函数中,判断当前鼠标位置是否在文字区域中void CGdipDrawView::OnLButtonUp(UINT nFlags, CPoint point) { // TODO: 在此添加消息处理程序代码和/或调用默认值
if(pRgn->IsVisible(point.x, point.y))
MessageBox(L"鼠标在区域内");
else MessageBox(L"鼠标在区域外");
}
// 在视图类的析构函数中,删除所创建的区域对象
CGdipDrawView::~CGdipDrawView() {
delete pRgn;
}
图15-9 击中测试
15.3 变换
变换(transform)是GDI+新增加的强大功能,包括图形对象的简单变换和基于矩阵的
坐标变换、图形变换、图像变换、色彩变换、路径变换和区域变换等。
15.3.1 图形对象变换
GDI+的核心——图形类Graphics,提供了3个方法,可以对其所绘制的图形进行平移(translate)、旋转(rotate)和伸缩(scale比例尺/缩放)等基本的图形变换(与纹理刷类中
的对应方法的原型是一样的):
Status TranslateTransform(REAL dx, REAL dy, MatrixOrder order = MatrixOrderPrepend);
Status RotateTransform(REAL angle, MatrixOrder order = MatrixOrderPrepend);
Status ScaleTransform(REAL sx, REAL sy, MatrixOrder order = MatrixOrderPrepend);
其中的最后一个输入参数为矩阵相乘的顺序,取值为矩阵顺序枚举类型MatrixOrder中的符
号常量,默认值都为MatrixOrderAppend(左乘):
typedef enum {
MatrixOrderPrepend = 0, // 矩阵左乘(预先序,前置)
MatrixOrderAppend = 1 // 矩阵右乘(追加序,后缀)
} MatrixOrder
因为这些变换都可以用矩阵表示,而且与图形对象已经设置的现有变换矩阵要进行合成(相
当于两个变换矩阵进行乘法运算)。
在图形对象的这三种基本变换中,最常用的是第一种——平移变换。我们在前面曾多次使用,避免了重复定义(有坐标平移的)绘图区域的麻烦。
1.平移变换
平移变换方法TranslateTransform ,将所绘制图形的坐标(x, y)全部平移一个增量(dx, dy): Status TranslateTransform (REAL dx, REAL dy, MatrixOrder order = MatrixOrderPrepend); 即坐标变换:
dy y y dx x x +=+='',相当于矩阵变换:???
?
??+???? ??=???? ??dy dx y x y x '',为了与旋转和伸缩等其他变换合成,矩阵变换一般写为如下的齐次坐标形式:
????
?
??????? ??=????? ??110010011''y x dy dx y x 例如(参见图15-10): Graphics graph(pDC->m_hDC);
Rect rectSquare(10, 10, 100, 100),
rectCircle(120, 10, 100, 100);
graph.DrawRectangle(&Pen(Color::Green), rectSquare); graph.DrawEllipse(&Pen(Color::Green), rectCircle); graph.TranslateTransform (30, 20);
graph.DrawRectangle(&Pen(Color::Red), rectSquare);
graph.DrawEllipse(&Pen(Color::Red), rectCircle);
图15-10 平移(30, 20)
图15-11 旋转30度
图15-12 旋转文本
2.旋转变换
旋转变换方法RotateTransform ,将所绘制图形的坐标(x, y)全部(相对于[默认位于左上角的]坐标原点)旋转一个角度α= angle (单位为度):
Status RotateTransform (REAL angle, MatrixOrder order = MatrixOrderPrepend);
即:
ααααcos sin 'sin cos 'y x y y x x +=-=,相当于矩阵变换???
?
?????? ??-=???? ??y x ααααy x cos sin sin cos ''或齐次坐标形式: ????
?
??????? ??-=????? ??11000cos sin 0sin cos 1''y x ααααy x 注意,旋转都是相对于坐标原点来进行的,为了使你的图形可以自由旋转,必须相对于原点来绘图。例如(参见图15-11):
Graphics graph(pDC->m_hDC);
Rect rectSquare(80, 10, 100, 100),
rectCircle(190, 10, 100, 100);
graph.DrawRectangle(&Pen(Color::Green), rectSquare); graph.DrawEllipse(&Pen(Color::Green), rectCircle); graph.RotateTransform (30.0f);
graph.DrawRectangle(&Pen(Color::Red), rectSquare);
graph.DrawEllipse(&Pen(Color::Red), rectCircle);
又例如(旋转文本,参见图15-12): Graphics graph(pDC->m_hDC); CRect crect;
GetClientRect(&crect);
PointF cp(REAL(crect.CenterPoint().x),
REAL(crect.CenterPoint().y));
Font font(L"宋体", 14);
SolidBrush textBrush(Color::Red); StringFormat stringFormat;
stringFormat.SetLineAlignment(StringAlignmentCenter);
graph.TranslateTransform(cp.X, cp.Y); // 旋转中心 for (int i = 0; i < 360; i += 30) { graph.RotateTransform(REAL(i)); // 旋转 graph.DrawString(L"旋转文本测试", -1, &font,
PointF(20.0f, 0.0f), &stringFormat, &textBrush);
graph.RotateTransform(REAL(-i)); // 还原
}
3.伸缩变换
伸缩变换方法ScaleTransform ,将所绘制图形的形状在x 和y 方向上按指定比例sx 和sy 进行缩放:
Status ScaleTransform (REAL sx, REAL sy, MatrixOrder order = MatrixOrderPrepend); 即:
y
sy y x sx x ?=?='',相当于矩阵变换???
?
?????? ??=????
??y x sy sx y x 00''或齐次坐标形式: ????
? ??????? ??=????? ??110000001''y x sy sx y x 例如(参见图15-13): Graphics graph(pDC->m_hDC);
Rect rectSquare(10, 10, 100, 100),
rectCircle(120, 10, 100, 100);
graph.DrawRectangle(&Pen(Color::Green), rectSquare); graph.DrawEllipse(&Pen(Color::Green), rectCircle); graph.ScaleTransform (1.5f, 0.5f);
graph.DrawRectangle(&Pen(Color::Red), rectSquare);
graph.DrawEllipse(&Pen(Color::Red), rectCircle);
图15-13 伸缩(1.5, 0.5)
图15-14 镜像文本