The Low Quiescent X-Ray Luminosity of the Neutron Star Transient XTE J2123-058
a r X i v :a s t r o -p h /0404287v 1 14 A p r 2004
D RAFT VERSION F EBRUARY 2,2008
Preprint typeset using L A T E X style emulateapj v.7/15/03
THE LOW QUIESCENT X-RAY LUMINOSITY OF THE NEUTRON STAR TRANSIENT XTE J2123–058
J OHN A.T OMSICK 1,D AWN M.G ELINO 1,J ULES P.H ALPERN 2,P HILIP K AARET 3
Draft version February 2,2008
ABSTRACT
We report on the ?rst X-ray observations of the neutron star soft X-ray transient (SXT)XTE J2123–058in quiescence,made by the Chandra X-ray Observatory and BeppoSAX ,as well as contemporaneous optical observations.In 2002,the Chandra spectrum of XTE J2123–058is consistent with a power-law model,or the combination of a blackbody plus a power-law,but it is not well-described by a pure https://www.wendangku.net/doc/5e16663943.html,ing the
interstellar value of N H ,the power-law ?t gives Γ=3.1+0.7
?0.6and indicates a 0.3–8keV unabsorbed luminosity
of (9+4?3)×10
31
(d /8.5kpc)2ergs s ?1(90%con?dence errors).Fits with models consisting of thermal plus power-law components indicate that the upper limit on the temperature of a 1.4M ⊙,10km radius neutron star with a hydrogen atmosphere is kT eff <66eV ,and the upper limit on the unabsorbed,bolometric luminosity is L ∞<1.4×1032ergs s ?1,assuming d =8.5kpc.Of the neutron star SXTs that exhibit short (<1year)outbursts,including Aql X-1,4U 1608–522,Cen X-4,and SAX J1810.8–2609,the lowest temperatures and luminosities are found for XTE J2123–058and SAX J1810.8–2609.From the BeppoSAX observation of XTE J2123–058in 2000,we obtained an upper limit on the 1–10keV unabsorbed luminosity of 9×1032ergs s ?1.Although this upper limit allows that the X-ray luminosity may have decreased between 2000and 2002,that possibility is not supported by our contemporaneous R -band observations,which indicate that the optical ?ux increased signi?cantly.Motivated by the theory of deep crustal heating by Brown and co-workers,we characterize the outburst histories of the ?ve SXTs.The low quiescent luminosity for XTE J2123–058is consistent with the theory of deep crustal heating without requiring enhanced neutron star cooling if the outburst recurrence time is ~>70years.
Subject headings:accretion,accretion disks —stars:individual (XTE J2123–058,SAX J1810.8–2609)—
stars:neutron —X-rays:stars
1.INTRODUCTION
Accreting neutron stars can be found in high-mass (HMXB)or low-mass (LMXB)X-ray binary systems.The majority of HMXBs have transient X-ray emission.Their outburst spec-tra are relatively hard and X-ray pulsations from these highly magnetized (B ~1012G)neutron stars are typically detected.A wide variety of X-ray behaviors are seen for neutron star LMXBs,but,in general,the lack of X-ray pulsations from most (but not all)of these systems,and the emission of type I X-ray bursts from some,suggest that they harbor neutron stars with relatively low magnetic ?eld strengths (B ~108?9G).During ≈33years of X-ray observations,some sources (e.g.,Sco X-1,Cyg X-2)have maintained luminosities approaching the Eddington limit of ≈1038ergs s ?1,while others are able to maintain persistent luminosities several orders of magni-tude lower (Wilson et al.2003).In addition,there is a class of transient neutron star LMXBs for which the luminosity varies from a substantial fraction of Eddington to quiescent levels typically near 1032?33ergs s ?1.In outburst,these systems have relatively soft spectra compared to the HMXBs,and are com-monly grouped with black hole transients as soft X-ray tran-sients (SXTs).
In quiescence,most neutron star SXTs exhibit X-ray en-ergy spectra with a component that is typically ?tted well by a blackbody,suggesting that the origin of this compo-1
Center for Astrophysics and Space Sciences,Code 0424,University of California at San Diego,La Jolla,CA,92093,USA (e-mail:jtom-sick@https://www.wendangku.net/doc/5e16663943.html,)
2Columbia Astrophysics Laboratory,Columbia University,550West 120th Street,New York,NY 10027
3Harvard-Smithsonian Center for Astrophysics,60Garden Street,Cam-bridge,MA,02138,USA
nent is thermal emission from the surface of a cooling neu-tron star.Although a pure blackbody often provides a good ?t to the spectrum,unphysical neutron star radii near 1km are inferred unless an atmosphere is modeled (Rutledge et al.1999).In addition to the thermal component,the energy spectra often contain a second component that has a power-law shape.The brightest and best studied systems in this class,Cen X-4and Aql X-1,usually display both compo-nents (Rutledge et al.2001,2002a;Campana &Stella 2003;Campana et al.2004).However,other systems may be dom-inated by the thermal component,such as MXB 1659–29(Wijnands et al.2003b)and sources X-5and X-7in the glob-ular cluster 47Tucanae (Heinke et al.2003),or by the power-law component,such as SAX J1808.4–3658(Campana et al.2002)and EXO 1745–248(Wijnands et al.2003a).Although theories for the thermal component,such as the deep crustal heating model of Brown,Bildsten &Rutledge (1998),are rel-atively well-developed and are being tested with observa-tions,the origin of the power-law component is not under-stood beyond suggestions that it may be related to accretion onto the neutron star magnetosphere (Campana et al.1998)or a putative pulsar wind colliding with infalling matter from the companion star (Tavani 1991).In addition to our lack of understanding of the power-law component,questions re-main about the mass accretion rate in quiescence,the ori-gin of rapid (100–10,000s)variability (Rutledge et al.2002a;Campana et al.2004),and the origin of variability in the ther-mal component on longer time scales (Rutledge et al.2002a).Another important question is if quiescent observational prop-erties correlate with other known differences between neutron star SXTs,such as whether they are millisecond X-ray pulsars (during outbursts)or not,whether the systems are in the ?eld
2J.A.Tomsick et al.
or in globular clusters,and whether their X-ray outbursts are long(years to decades)or short(weeks to months).
Here,we report on X-ray and optical observations of the ?eld neutron star SXT XTE J2123–058taken during qui-escence.XTE J2123–058had its only detected X-ray out-burst in1998June-August(Levine,Swank&Smith1998; Tomsick et al.1999),and we focus on observations made with Chandra,BeppoSAX,and optical telescopes2–4years after the outburst.During the outburst,the Rossi X-ray Timing Explorer(RXTE)detected type I X-ray bursts and a pair of kHz quasi-periodic oscillations(Homan et al.1999; Tomsick et al.1999),indicating that the system contains a rapidly rotating neutron star.However,coherent X-ray pulsations were not found.The6hr binary orbital pe-riod and the fact that the binary inclination of the sys-tem is relatively high were established from optical mod-ulation and the presence of partial eclipses in the opti-cal light curve(Tomsick et al.1999;Soria,Wu&Galloway 1999;Zurita et al.2000;Shahbaz et al.2003).The high Galactic latitude(b=?36?)and low extinction have allowed for detailed optical studies of XTE J2123–058in quiescence even though the source is rather faint at its relatively large distance(8.5±2.5kpc).The optical observations show that XTE J2123–058consists of a K7V star on or close to the main sequence and a neutron star for which mass determi-nations of1.5±0.3M⊙(Tomsick et al.2001;Casares et al. 2002;Tomsick et al.2002)and1.04–1.56M⊙(Shahbaz et al. 2003)have been obtained.The focus of this paper is the?rst X-ray study of XTE J2123–058in quiescence.
2.OBSERV ATIONS AND ANALYSIS
We observed XTE J2123–058with Chandra on UT2002 November13(ObsID2709),using the Advanced CCD Imag-ing Spectrometer(ACIS)with the target placed on one of the back-illuminated ACIS chips(ACIS-S3).For our anal-ysis,we used the“level2”event list produced by the stan-dard data processing with ASCDS version6.9.2using Cal-ibration Data Base(CALDB)version2.17.Light curves using counts from the full?eld-of-view do not show any background?ares,allowing us to use the data from the full 17,706s https://www.wendangku.net/doc/5e16663943.html,ing the Chandra Interactive Analysis of Observations(CIAO)version3.0software routine wavde-tect(Freeman et al.2002),we searched for sources on the S3 chip in the0.3–8keV energy band.We detected22sources with counts between5and108per source,using a detec-tion threshold of10?6,including a24count source at R.A. =21h23m14s.54,decl.=?05?47′53′′.2(equinox J2000,un-certainty0′′.6).This position is consistent with the target’s optical position(Tomsick et al.1999),and we conclude that this source is the quiescent X-ray counterpart of XTE J2123–058.
We also report on a BeppoSAX observation of the XTE J2123–058?eld made on UT2000May12–13.We produced 1–10keV images using the data from the two Medium En-ergy Concentrator/Spectrometer(MECS)units that were op-erational during the observation(units2and3).We also pro-duced a0.1–10keV image using data from the Low Energy Concentrator/Spectrometer(LECS).We obtained a MECS exposure time of46,340s and a LECS exposure time of 17,080s.To search for sources,we convolved each of the three images with a two-dimensional Gaussian with a width (σ)of5pixels(40′′)in both directions.Only one source was clearly detected in both of the MECS images at R.A.= 21h22m50s.6,decl.=?05?45′09′′(equinox J2000,uncertainty ~1′),and this source,which we call SAX J2122.8–0575,is also present in the LECS image.It is clear that SAX J2122.8–0575is not XTE J2123–058as they are separated by6′.6.We conclude that XTE J2123–058was not detected during the BeppoSAX observation,and we derive an upper limit on its X-ray?ux below.
Finally,we obtained R-band images on three occasions close to the times of the X-ray observations.As shown in Table1,we observed XTE J2123–058using the2.4m Hiltner telescope of the MDM Observatory on2000July24,about 2months after the BeppoSAX observation.We also observed XTE J2123–058with the Shane3m telescope of Lick Ob-servatory about2months before the Chandra observation and again at MDM about2weeks after the Chandra observation. For both MDM runs,we used the same SITe2048×2048 pixel,thinned,back-illuminated CCD with a spatial scale of 0′′.275per24μm pixel,and an R?lter that is very close to Harris R.4At Lick,we used the Prime Focus Camera,with a SITe2048×2048pixel,thinned CCD with a spatial scale of0′′.296per24μm pixel,and a Kron-Cousins R?lter.In all,we obtained thirteen600–700s exposures(see Table1), and we reduced the images using standard IRAF5routines. For XTE J2123–058,we carried out the photometry with the IRAF package phot and used two calibrated reference stars with R magnitudes of19.47and19.51.In2002,the con-ditions at Lick were photometric,and we observed Landolt (1992)standards to obtain the calibration.We note that this calibration is about0.1magnitudes brighter than the calibra-tion previously obtained using MDM observations from1998 reported in Tomsick et al.(1999).
3.ENERGY SPECTRUM AND SOURCE LUMINOSITY
We used the CIAO software routine psextract to produce the ACIS energy spectrum for XTE J2123–058and to create the appropriate instrument response matrix for the spectrum. The software used CALDB2.23to create the response matrix, and we included a correction for the time-dependence of the ACIS response.The source spectrum included counts from a circular region with a5pixel(about2′′.5)radius,and we es-timated the background level using counts from a source-free annulus around the target position.The source spectrum con-sists of24counts,and we estimate a background level of0.7 counts in the extraction region.We produced a“light curve”of the source in six time bins of≈3000s.Each bin contains between2and6counts,which is consistent with a constant ?ux;however,the low count rate does not allow us to place tight constraints on the possible amplitude of variability.The small number of counts also indicates thatχ2statistics are not appropriate for spectral analysis,as the assumption of a Gaussian probability distribution in each spectral bin is not met.Thus,we carried out our spectral analysis by minimiz-ing the Cash statistic(Cash1979),which is appropriate in cases where the assumption of a Poisson probability distribu-tion in each spectral bin is valid.We?tted the spectrum using XSPEC11.2.
The spectra of other neutron star SXTs are typically well-described by a blackbody,a power-law,or both components with interstellar absorption.We began by?tting the spec-4See https://www.wendangku.net/doc/5e16663943.html,/obs/mdm/technical/?lters for the ex-act transmission curve.
5IRAF(Image Reduction and Analysis Facility)is distributed by the Na-tional Optical Astronomy Observatories,which are operated by the Asso-ciation of Universities for Research in Astronomy,Inc.,under cooperative agreement with the National Science Foundation.
XTE J2123–058in Quiescence 3
10-5
10-410-310-2C o u n t s s -1 k e V -1
a
1
10
Energy (keV)
10-7
10-6
E F E (k e V c m -2 s -1)
b
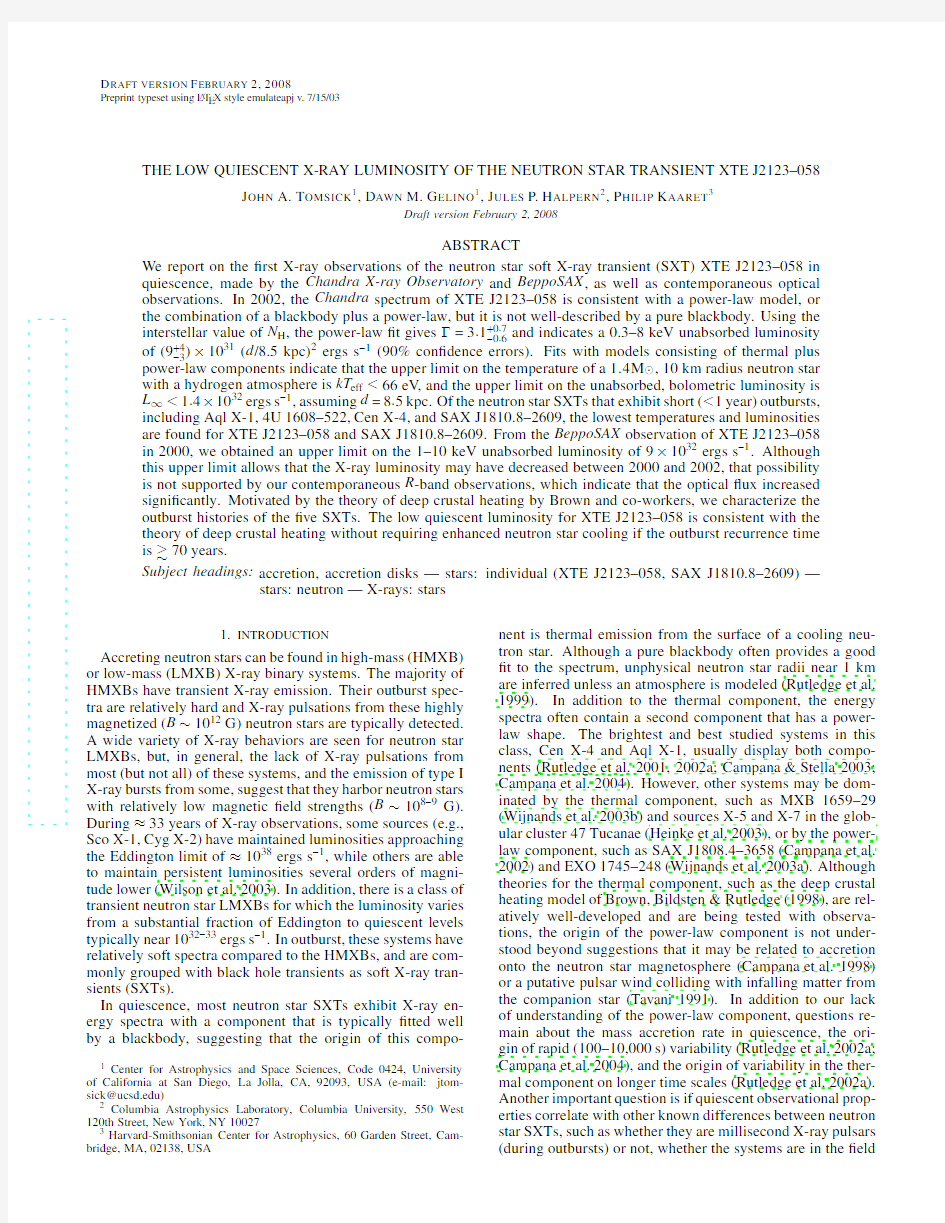
F I
G .1.—Chandra /ACIS energy spectrum of XTE J2123–058.Top :folded through the detector response.Bottom :unfolded.In each panel,the solid line is a power-law ?t to the data (using Cash statistics as described in the text)with N
H ?xed at the interstellar value.The power-law photon index is
3.1+0.7?0.6,and the unabsorbed 0.3–8keV luminosity is (9+4?3)×1031ergs s ?1.A
blackbody model (dashed line ),by itself,does not provide a good description of the spectrum.
trum for XTE J2123–058with an absorbed power-law,and the results are given in Table 2.Once we found the best-?tted parameters by minimizing the Cash statistic,we determined the quality of the ?t and the 90%con?dence errors on the parameters by producing and ?tting 10,000simulated spec-tra.We used the best-?tted parameters from the ?ts to the actual data as input to the https://www.wendangku.net/doc/5e16663943.html,ing simulations to determine the parameter errors is necessary only because of the small number of counts in the spectrum.We tested our method by producing spectra with 2–3times as many counts,and we found that the errors produced by calculating changes in the Cash statistic (the standard technique)match the val-ues we obtain using simulations.In addition to the power-law model,we used simulations to determine the errors on param-eter for all other ?ts presented in this work.For the power-law
model,we obtain N H =(7.0+40.0?7.0)×1020cm
?2
for the column density and Γ=3.1+2.8
?0.8for the photon index.The ?t using a blackbody model is signi?cantly worse than the power-law model as indicated by the fact that for 97%of the simulated spectra we obtained a better Cash statistic than the one ob-tained when ?tting the actual spectrum (compared to 69%for the power-law model).
We re?tted the spectrum with the same spectral mod-els but with N H ?xed to the interstellar column density.The interstellar N H comes from the A V measurement of Hynes et al.(2001),which gives N H =(6.6±2.7)×1020cm ?2,and the total Galactic H I value of 5.7×1020cm ?2from Dickey &Lockman (1990).We adopt a value of 6×10²⁰
cm ?2.For the power-law alone,we obtain Γ=3.1+0.7
?0.6and an
unabsorbed 0.3–8keV ?ux of (1.1+0.5
?0.4)×10
?14ergs cm ?2s ?1,which corresponds to a luminosity of (9+4?3)×10
31
ergs s ?1at a distance of 8.5kpc.The best ?tted blackbody temper-ature is 240+60
?50eV ,but the quality of the blackbody ?t is even worse (98.7%)with N H ?xed.Figure 1shows the spectrum (rebinned for clarity,although the Cash ?ts are performed without rebinning)along with the best ?tted power-law and blackbody models with N H ?xed.It is clear that the curvature of the blackbody model is too large,underpredicting the ob-served spectrum below 0.7keV and above 2keV .This,along with the measurements of the ?t quality from the simulations,indicates that the spectrum is well-described by a power-law model or the combination of a blackbody and a power-law model,but it is not well-described by a blackbody alone.Although a power-law alone provides an adequate descrip-tion of the ACIS spectrum,we performed additional ?ts to obtain limits on the temperature and luminosity of the puta-tive thermal component that is expected to be emitted from the surface of the neutron star.We ?tted the spectrum with a model consisting of a power-law component along with ther-mal emission from an atmosphere composed of hydrogen.The latter component was modeled using the “Neutron Star Atmosphere”(NSA)model of Zavlin,Pavlov &Shibanov (1996).We assumed a neutron star mass of 1.4M ⊙,which is consistent with the measured mass,and a radius of 10km.With these parameters ?xed,the remaining free parameters in the NSA model are the temperature (kT eff )and the distance.For XTE J2123–058,there are several arguments that lead to distance estimates in the range 5–15kpc (Tomsick et al.1999;Homan et al.1999;Zurita et al.2000),but the most reliable estimates come from optical observations of the source in qui-escence.Previous estimates include 8±3kpc (Zurita et al.2000),8.5±2.5kpc (Tomsick et al.2001),and 9.6±1.3kpc (Casares et al.2002).Here,we adopt a range of 6–11kpc.We performed the NSA plus power-law ?ts with the distance ?xed to three values spanning this range (6,8.5,and 11kpc).As shown in Table 3,the 90%con?dence upper limits on kT eff are 57,66,and 73eV ,respectively,for these three https://www.wendangku.net/doc/5e16663943.html,-ing L ∞=4πR 2σT 4
eff (1?2GM /Rc 2),where R =10km and M =1.4M ⊙,upper limits on the unabsorbed luminosity from the NSA component as seen by a distant observer are 8.0×1031,1.4×1032and 2.1×1032ergs s ?1for distances of 6,8.5,and 11kpc,respectively.While these values are bolometric lumi-nosities,it should be noted that we cannot rule out the pos-sibility that there is thermal emission at energies below the Chandra bandpass.
Although XTE J2123–058was not detected by BeppoSAX in 2000May,we can calculate upper limits on its luminos-ity if we assume that the energy spectrum was similar to that measured by Chandra .To calculate the upper limits,we as-sume the simplest model of an absorbed power-law with a photon index of 3.1and the interstellar column density.For the MECS (units 2and 3combined),we measure a 1–10keV count rate of 1.684ks ?1in a circle of radius 2′centered on the XTE J2123–058position.This is not signi?cantly higher than the expected background rate (using a blank-sky pointing)of 1.675ks ?1.These values imply a 3-σupper limit on the count rate from XTE J2123–058of 0.676ks ?1,which corresponds to an unabsorbed ?ux <1.02×10?13ergs cm ?2s ?1,and a 1–10keV luminosity <9×1032ergs s ?1for d =8.5kpc.For the LECS,the 0.1–1keV count rate in a 2′radius circle centered on XTE J2123–058is 1.230ks ?1,which is actually somewhat lower than the expected background rate of 1.466ks ?https://www.wendangku.net/doc/5e16663943.html,ing the expected background rate,the 3-σupper limit on the un-absorbed 0.1–1keV ?ux is 1.75×10?12ergs cm ?2s ?1,corre-
4J.A.Tomsick et al.
sponding to a luminosity <1.5×1034ergs s ?1for d =8.5kpc.
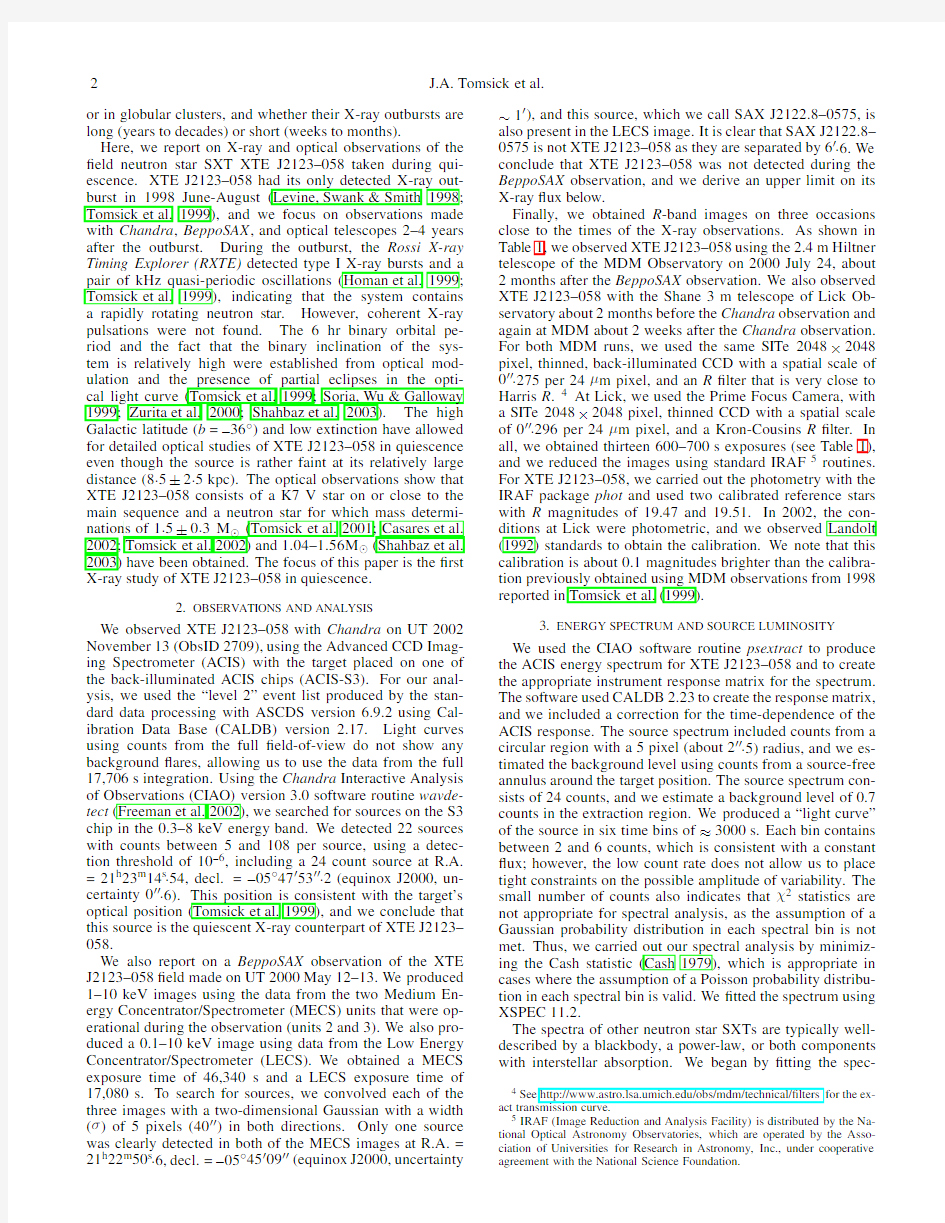
4.OPTICAL RESULTS
Figure 2shows the R magnitudes for XTE J2123–058from three exposures taken in 2000July at MDM,two exposures taken in 2002September at Lick,and eight exposures taken in 2002November at MDM.Previously,Shahbaz et al.(2003)reported on extensive R -band photometry of XTE J2123–058taken between 1999June and 2000August.The R -band light curve was relatively stable at that time,showing or-bital ellipsoidal modulations with a peak-to-peak amplitude of about 0.25magnitudes.The dashed lines in Figure 2in-dicate the range of the modulation in 1999–2000,which was 21.70 As we are reporting the ?rst sensitive X-ray observations of XTE J2123–058in quiescence,comparison can be made with a prior prediction for the quiescent X-ray luminosity of this source that was made by modeling quiescent R -band light curves in 1999and 2000.Shahbaz et al.(2003)predicted an X-ray luminosity of ~1033ergs s ?1,which is only slightly higher than our upper limit from the BeppoSAX observation made in 2000,but an order of magnitude higher than we ob-served with Chandra in 2002.While the X-ray observations would allow for the possibility that the quiescent X-ray lu-minosity decreased signi?cantly between 2000and 2002,our optical observations made in 2000and 2002indicate that the R -band ?ux actually increased over this time.If the 2000R -band light curve showed a signi?cant contribution from X-ray heating,it is dif?cult to see how a drop in X-ray ?ux could lead to an increase in the optical,thus,it is possible that Shahbaz et al.(2003)over-estimated the contribution from X-ray heating. 5.INTERPRETATION X-ray observations of neutron star SXTs in quiescence provide tests of theoretical models for the thermal com-ponent.According to the theory of deep crustal heating by Brown,Bildsten &Rutledge (1998),the temperature of the neutron star core is maintained by nuclear reactions in the deep crust that occur when the mass accretion rate is high during outburst.As the thermal time scale for the core is ~10,000years (Colpi et al.2001),the level of qui-escent thermal emission is set by the average mass accre-tion rate over this time span according to L q =9×1032 <˙M >?11ergs s ?1(see Equation 1of Rutledge et al.2002b),assuming 1.45MeV of heat deposited in the crust per ac-creted nucleon (Haensel &Zdunik 1990).Here <˙M >?11is HJD-2451000 (days) R -m a g n i t u d e HJD-2451000 (days) R -m a g n i t u d e HJD-2451000 (days) R -m a g n i t u d e F I G .2.—R -band measurements of XTE J2123–058.(a )2000July at MDM Observatory.(b )2002September at Lick Observatory.(c )2002Novem-ber at MDM Observatory.The dashed lines delimit the levels measured by Shahbaz et al.(2003)during 1999–2000.An increase in the R -band ?ux be-tween 2000and 2002is apparent. the mass accretion rate averaged over the thermal time scale of the core in units of 10?11M ⊙yr ?1,and L q is the quiescent bolometric luminosity.While the time-averaged mass accre-tion rate is only a predictor of L q if the neutron star core has reached thermal equilibrium,the lifetimes of LMXB systems are much longer than the thermal time scale of the core,and it is expected that thermal equilibrium has been established for all or nearly all of the LMXBs.While the long thermal time scale for the core precludes appreciable changes in the core temperature during a single SXT outburst,the neutron star crust can be heated signi?cantly for the systems with longer outbursts (years to decades)so that the quiescent emission is determined by the evolution of the physical conditions in the crust (Rutledge et al.2002b).However,for the systems with shorter outbursts (weeks to months),the properties of the qui-escent thermal emission are primarily set by the conditions in the neutron star core (Brown,Bildsten &Rutledge 1998).For a system like XTE J2123–058that has undergone one ≈40day outburst,the deep crustal heating theory implies that quiescent thermal emission provides information about the neutron star core.Here,we compare the quiescent prop-erties of XTE J2123–058to similar systems.The compar-ison group includes ?eld neutron star SXTs with outbursts lasting less than 1year for which quiescent X-ray observa-tions have been reported.We only consider LMXB systems XTE J2123–058in Quiescence5 from which X-ray bursts have been detected,proving that the accreting object is a neutron star.We restrict the compari- son group to?eld systems because the outburst histories for most transients in globular clusters are uncertain due to source confusion in instruments with angular resolution worse than Chandra.Thus,our comparison group consists of the neu- tron star SXTs Aql X-1,4U1608–522,Cen X-4,and SAX J1810.8–2609.We also compare the quiescent properties of XTE J2123–058to those of the millisecond X-ray pulsar SAX J1808.8–3658as the quiescent X-ray luminosities of the two sources are comparable. Table4compares the parameters of the thermal compo- nent for the?ve systems,including kT eff,R,L∞,and the gravitational redshift parameter,g= 6J.A.Tomsick et al. had an outburst during the RXTE lifetime).These light curves demonstrate that individual outbursts from different sources are similar in duration(typically40–80days)and overall shape,although it should be noted that exceptional outbursts do occur(Chen,Shrader&Livio1997). For each of the neutron star SXTs,the time-averaged mass accretion rate over the past33years can be expressed as <˙M>=ˉL peak Nt outburst f XTE J2123–058in Quiescence7 REFERENCES Brown,E.F.,Bildsten,L.,&Rutledge,R.E.,1998,ApJ,504,L95 Campana,S.,Colpi,M.,Mereghetti,S.,Stella,L.,&Tavani,M.,1998, A&A Rev.,8,279 Campana,S.,Israel,G.L.,Stella,L.,Gastaldello,F.,&Mereghetti,S.,2004, ApJ,601,474 Campana,S.,&Stella,L.,2003,ApJ,597,474 Campana,S.,et al.,2002,ApJ,575,L15 Casares,J.,Dubus,G.,Shahbaz,T.,Zurita,C.,&Charles,P.A.,2002, MNRAS,329,29 Cash,W.,1979,ApJ,228,939 Chen,W.,Shrader,C.R.,&Livio,M.,1997,ApJ,491,312 Colpi,M.,Geppert,U.,Page,D.,&Possenti,A.,2001,ApJ,548,L175 Dickey,J.M.,&Lockman,F.J.,1990,ARA&A,28,215 Freeman,P.E.,Kashyap,V.,Rosner,R.,&Lamb,D.Q.,2002,ApJS,138, 185 Greiner,J.,Castro-Tirado,A.J.,Boller,T.,Duerbeck,H.W.,Covino,S., Israel,G.L.,Linden-V?rnle,M.J.D.,&Otazu-Porter,X.,1999,MNRAS, 308,L17 Haensel,P.,&Zdunik,J.L.,1990,A&A,227,431 Heinke,C.O.,Grindlay,J.E.,Lloyd,D.A.,&Edmonds,P.D.,2003,ApJ, 588,452 Homan,J.,Méndez,M.,Wijnands,R.,van der Klis,M.,&van Paradijs,J., 1999,ApJ,513,L119 Hynes,R.I.,Charles,P.A.,Haswell,C.A.,Casares,J.,Zurita,C.,&Serra-Ricart,M.,2001,MNRAS,324,180 Jonker,P.G.,Wijnands,R.,&van der Klis,M.,2004,MNRAS,349,94 Landolt,A.U.,1992,AJ,104,340 Levine,A.,Swank,J.,&Smith,E.,1998,IAU Circular,6955 Natalucci,L.,Bazzano,A.,Cocchi,M.,Ubertini,P.,Heise,J.,Kuulkers,E., in’t Zand,J.J.M.,&Smith,M.J.S.,2000,ApJ,536,891Rutledge,R.E.,Bildsten,L.,Brown,E.F.,Pavlov,G.G.,&Zavlin,V.E., 1999,ApJ,514,945 Rutledge,R.E.,Bildsten,L.,Brown,E.F.,Pavlov,G.G.,&Zavlin,V.E., 2001,ApJ,551,921 Rutledge,R.E.,Bildsten,L.,Brown,E.F.,Pavlov,G.G.,&Zavlin,V.E., 2002a,ApJ,577,346 Rutledge,R.E.,Bildsten,L.,Brown,E.F.,Pavlov,G.G.,Zavlin,V.E.,& Ushomirsky,G.,2002b,ApJ,580,413 Shahbaz,T.,Zurita,C.,Casares,J.,Dubus,G.,Charles,P.A.,Wagner,R.M., &Ryan,E.,2003,ApJ,585,443 Soria,R.,Wu,K.,&Galloway,D.K.,1999,MNRAS,309,528 Tavani,M.,1991,ApJ,379,L69 Tomsick,J.A.,Halpern,J.P.,Kemp,J.,&Kaaret,P.,1999,ApJ,521,341 Tomsick,J.A.,Heindl,W.A.,Chakrabarty,D.,Halpern,J.P.,&Kaaret,P., 2001,ApJ,559,L123 Tomsick,J.A.,Heindl,W.A.,Chakrabarty,D.,&Kaaret,P.,2002,ApJ,581, 570 Wijnands,R.,Heinke,C.O.,Pooley,D.,Edmonds,P.D.,Lewin,W.H.G., Grindlay,J.E.,Jonker,P.G.,&Miller,J.M.,2003a,astro-ph/0310144 Wijnands,R.,Homan,J.,Miller,J.M.,&Lewin,W.H.G.,2003b, astro-ph/0310612 Wijnands,R.,Miller,J.M.,Markwardt,C.,Lewin,W.H.G.,&van der Klis, M.,2001,ApJ,560,L159 Wilson,C.A.,Patel,S.K.,Kouveliotou,C.,Jonker,P.G.,van der Klis,M., Lewin,W.H.G.,Belloni,T.,&Méndez,M.,2003,ApJ,596,1220 Zavlin,V.E.,Pavlov,G.G.,&Shibanov,Y.A.,1996,A&A,315,141 Zurita,C.,et al.,2000,MNRAS,316,137 8J.A.Tomsick et al. T ABLE1 XTE J2123–058X-R AY AND O PTICAL O BSERVATIONS Observatory UT Date Energy Band Exposure Time(s) BeppoSAX2000May12–130.1?10keV46,340a MDM2000July24Harris R3×600 Lick2002September11Kron-Cousins R2×700 Chandra2002November130.3?8keV17,706 MDM2002November25Harris R8×600 a This is the MECS exposure time.The LECS exposure time is17,080s. T ABLE2 S PECTRAL F ITS Model N H aΓF pl b kT bb L/d28.5c Fit (1020cm?2)(10?14ergs cm?2s?1)(eV)(1032ergs s?1)Quality d pl7.0+40.0 ?7.03.1+2.8 ?0.8 1.2+31.9 ?0.5 ——0.69 bb0.0+40.0 ?0.0——260+50 ?110 0.49+2.76 ?0.12 0.97 bb+pl8.0+38.0 ?8.02.5+2.9 ?2.3 0.70+3.67 ?0.48 100+130 ?60 0.9+160 ?0.7 0.66 1?2GM/Rc2assuming M=1.4M⊙. d Th e time-averaged mass accretion rate over the past33years,estimated according to<˙M>=sˉL peak N,where s=1.1×10?23s2cm?2(see Equation1). e The range o f values found in three separate Chandra observations. 第18章X射线光电子能谱分析 18.1 引言 固体表面分析业已发展为一种常用的仪器分析方法,特别是对于固体材料的分析和元素化学价态分析。目前常用的表面成分分析方法有:X射线光电子能谱(XPS), 俄歇电子能谱(AES),静态二次离子质谱(SIMS)和离子散射谱(ISS)。AES 分析主要应用于物理方面的固体材料科学的研究,而XPS的应用面则广泛得多,更适合于化学领域的研究。SIMS和ISS由于定量效果较差,在常规表面分析中的应用相对较少。但近年随着飞行时间质谱(TOF-SIMS)的发展,使得质谱在表面分析上的应用也逐渐增加。本章主要介绍X射线光电子能谱的实验方法。 X射线光电子能谱(XPS)也被称作化学分析用电子能谱(ESCA)。该方法是在六十年代由瑞典科学家Kai Siegbahn教授发展起来的。由于在光电子能谱的理论和技术上的重大贡献,1981年,Kai Siegbahn获得了诺贝尔物理奖。三十多年的来,X射线光电子能谱无论在理论上和实验技术上都已获得了长足的发展。XPS已从刚开始主要用来对化学元素的定性分析,业已发展为表面元素定性、半定量分析及元素化学价态分析的重要手段。XPS的研究领域也不再局限于传统的化学分析,而扩展到现代迅猛发展的材料学科。目前该分析方法在日常表面分析工作中的份额约50%,是一种最主要的表面分析工具。 在XPS谱仪技术发展方面也取得了巨大的进展。在X射线源上,已从原来的激发能固定的射线源发展到利用同步辐射获得X射线能量单色化并连续可调的激发源;传统的固定式X射线源也发展到电子束扫描金属靶所产生的可扫描式X射线源;X射线的束斑直径也实现了微型化,最小的束斑直径已能达到6μm大小, 使得XPS在微区分析上的应用得到了大幅度的加强。图像XPS技术的发展,大大促进了XPS在新材料研究上的应用。在谱仪的能量分析检测器方面,也从传统的单通道电子倍增器检测器发展到位置灵敏检测器和多通道检测器,使得检测灵敏度获得了大幅度的提高。计算机系统的广泛采用,使得采样速度和谱图的解析能力也有了很大的提高。 由于XPS具有很高的表面灵敏度,适合于有关涉及到表面元素定性和定量分析方面的应用,同样也可以应用于元素化学价态的研究。此外,配合离子束剥离技术和变角XPS技术,还可以进行薄膜材料的深度分析和界面分析。因此,XPS 方法可广泛应用于化学化工,材料,机械,电子材料等领域。 18.2 方法原理 X射线光电子能谱基于光电离作用,当一束光子辐照到样品表面时,光子可以被样品中某一元素的原子轨道上的电子所吸收,使得该电子脱离原子核的束缚,以一定的动能从原子内部发射出来,变成自由的光电子,而原子本身则变成一个激发态的离子。在光电离过程中,固体物质的结合能可以用下面的方程表示: E k = hν- E b - φs (18.1) 射线数字成像专业书籍 射线数字成像专业书籍《实时射线成像检测》王建华李树轩编著 目录: 前言 第1章射线成像的物理基础 1.1物质构成 1.1.1元素 1.1.2原子 1.2同位素 1.2.1核素 1.2.2同位素 1.2.3核素分类 1.2.4原子能级 1.3原子核结构 1.3.1核力 1.3.2核稳定性 1.3.3放射性衰变 1.4射线种类和性质 1.4.1射线分类 1.4.2X射线和γ射线的性质 1.4.3X射线和γ射线的不同点 1.4.4射线胶片照相中使用的射线 1.5射线的产生 1.5.1X射线的产生 1.5.2γ射线的产生 1.5.3高能X射线 1.5.4中子射线 1.6射线与物质的相互作用 1.6.1光电效应 1.6.2康普顿效应 1.6.3电子对效应 1.6.4瑞利散射 1.6.5各种效应相互作用发生相对的几率 1.7射线的衰减规律 1.7.1吸收、散射与衰减 1.7.2射线的色和束 1.7.3单色窄束射线的衰减规律 1.7.4宽束、多色射线的衰减规律(包括连续X射线) 测试题(是非题) 第2章实时成像 2.1实时成像的基础 2.1.1简述 2.1.2实时成像的原理 2.1.3射线成像的特点 2.1.4射线成像的应用 2.1.5实时成像局限性 2.2实时成像技术 2.2.1实时成像系统 2.2.2射线成像设备 2.2.3成像系统的构成 2.2.4成像转换装置(成像器) 2.3射线辐射转换器 2.3.1X射线荧光检验屏 2.3.2X射线图像增强器 2.4射线数字化成像技术 2.4.1计算机射线照相技术 2.4.2线阵列扫描成像技术 2.4.3光纤CCD射线实时成像检测系统(简称光纤CCD系统) 2.4.4数字平板直接成像技术 锂硫电池的研究现状 近年来,随着不可再生资源的逐渐减少,清洁能源的利用逐渐得到重视,而电池作为储能装置也受到越来越多的考验。锂硫电池与传统的锂离子电池相比,优势主要在于硫的高比容量,单质硫的理论比容量为1600mAh/g ,理论比能量2600Wh/kg。并且硫是一种廉价且无毒的原材料。而与此同时,硫作为锂电池的正极材料也存在着诸多问题[1]: 1、单质硫以及最终放电产物都是绝缘的,如果与正极中掺入的导电物质结合不好,就会导致活性物质不能参与反应而失效; 2、单质硫在反应过程中会生成长链的聚硫化物离子S n2-,这种离子容易溶解在电解液中,并与锂负极反应,产生“穿梭效应”,引起自放电并使库伦效率降低; 3、在每次放电过程结束之后,都会有一些Li2S2/Li2S沉淀在正极上,并且这些不溶物随着循环次数的增加,在正极表面发生团聚,并且正极结构也会发生变化,导致这部分活性物质不能参与电化学反应而失效,并且使电池的内阻增加; 4、硫正极随充放电的进行会产生约22%的体积变化,从而导致电池物理结构破坏而失效。 针对硫作为正极材料的种种弊端,研究者们分别采用了多种方法予以解决,其中将硫与碳材料复合的研究较多。针对几种典型方法,分别举例介绍如下:一、石墨烯-硫复合材料 Wang等人采用石墨烯包覆硫颗粒的方法制作复合材料电极[2]。如图1所示,他们首先采用化学方法制备了硫单质,并利用一种特殊的表面活性剂Triton X-100在硫颗粒的表面修饰了一些PEG高分子,然后再用导电炭黑和石墨烯的分散液对硫颗粒进行包覆。这种方法的优点在于:首先,石墨烯和导电炭黑具有优异的导电性能,可以克服硫以及硫反应产物绝缘的问题;第二,导电炭黑、石墨烯和PEG高分子对硫颗粒进行了包覆,可以解决硫在电解液中溶出的问题;第三,PEG高分子具有一定的弹性,可以在一定程度上缓解体积变化带来的影响。 二、碳纳米管-硫复合材料 Zheng等人用AAO做模板制备了碳纳米管阵列[3],随后将硫加热使其浸入到碳纳米管中间,然后将AAO模板去掉,得到碳纳米管-硫复合材料,如图2所示。这种方法的优点在于碳纳米管的比表面积大,有利于硫化锂的沉积。并且长径比较大,可以较好地将硫限制在管内,防止其溶解在电解液中。碳纳米管的导电性好管壁又很薄,有利于离子导通和电子传输。同时,因为制备过程中先沉积硫,后去除模板,这样有利于使硫沉积到碳管内,减少硫在管外的残留,从而防止这部分硫的溶解。 X射线光电子能谱分析 1 引言 固体表面分析业已发展为一种常用的仪器分析方法,特别是对于固体材料的分析和元素化学价态分析。目前常用的表面成分分析方法有:X射线光电子能谱(XPS), 俄歇电子能谱(AES),静态二次离子质谱(SIMS)和离子散射谱(ISS)。AES分析主要应用于物理方面的固体材料科学的研究,而XPS的应用面则广泛得多,更适合于化学领域的研究。SIMS和ISS由于定量效果较差,在常规表面分析中的应用相对较少。但近年随着飞行时间质谱(TOF-SIMS)的发展,使得质谱在表面分析上的应用也逐渐增加。本章主要介绍X射线光电子能谱的实验方法。 X射线光电子能谱(XPS)也被称作化学分析用电子能谱(ESCA)。该方法是在六十年代由瑞典科学家Kai Siegbahn教授发展起来的。由于在光电子能谱的理论和技术上的重大贡献,1981年,Kai Siegbahn获得了诺贝尔物理奖。三十多年的来,X射线光电子能谱无论在理论上和实验技术上都已获得了长足的发展。XPS已从刚开始主要用来对化学元素的定性分析,业已发展为表面元素定性、半定量分析及元素化学价态分析的重要手段。XPS的研究领域也不再局限于传统的化学分析,而扩展到现代迅猛发展的材料学科。目前该分析方法在日常表面分析工作中的份额约50%,是一种最主要的表面分析工具。 在XPS谱仪技术发展方面也取得了巨大的进展。在X射线源上,已从原来的激发能固定的射线源发展到利用同步辐射获得X射线能量单色化并连续可调的激发源;传统的固定式X射线源也发展到电子束扫描金属靶所产生的可扫描式X射线源;X射线的束斑直径也实现了微型化,最小的束斑直径已能达到6 m 大小, 使得XPS在微区分析上的应用得到了大幅度的加强。图像XPS技术的发展,大大促进了XPS在新材料研究上的应用。在谱仪的能量分析检测器方面,也从传统的单通道电子倍增器检测器发展到位置灵敏检测器和多通道检测器,使得检测灵敏度获得了大幅度的提高。计算机系统的广泛采用,使得采样速度和谱图的解析能力也有了很大的提高。 由于XPS具有很高的表面灵敏度,适合于有关涉及到表面元素定性和定量分析方面的应用,同样也可以应用于元素化学价态的研究。此外,配合离子束剥离技术和变角XPS技术,还可以进行薄膜材料的深度分析和界面分析。因此,XPS方法可广泛应用于化学化工,材料,机械,电子材料等领域。 2 方法原理 X射线光电子能谱基于光电离作用,当一束光子辐照到样品表面时,光子可以被样品中某一元素的原子轨道上的电子所吸收,使得该电子脱离原子核的束缚,以一定的动能从原子内部发射出来,变成自由的光电子,而原子本身则变成 第十四章 X-射线光电子能谱法 14.1 引言 X-射线光电子谱仪(X-ray Photoelectron Spectroscopy,简称为XPS),经常又被称为化学分析用电子谱(Electron Spectroscopy for Chemical Analysis,简称为ESCA),是一种最主要的表面分析工具。自19世纪60年代第一台商品化的仪器开始,已经成为许多材料实验室的必不可少的成熟的表征工具。XPS发展到今天,除了常规XPS外,还出现了包含有Mono XPS (Monochromated XPS, 单色化XPS,X射线源已从原来的激发能固定的射线源发展到利用同步辐射获得X射线能量单色化并连续可调的激发源), SAXPS ( Small Area XPS or Selected Area XPS, 小面积或选区XPS,X射线的束斑直径微型化到6μm) 和iXPS(imaging XPS, 成像XPS)的现代XPS。目前,世界首台能量分辨率优于1毫电子伏特的超高分辨光电子能谱仪(通常能量分辨率低于1毫电子伏特)在中日科学家的共同努力下已经研制成功,可以观察到化合物的超导电子态。现代XPS拓展了XPS的内容和应用。 XPS是当代谱学领域中最活跃的分支之一,它除了可以根据测得的电子结合能确定样品的化学成份外,XPS最重要的应用在于确定元素的化合状态。XPS可以分析导体、半导体甚至绝缘体表面的价态,这也是XPS的一大特色,是区别于其它表面分析方法的主要特点。此外,配合离子束剥离技术和变角XPS技术,还可以进行薄膜材料的深度分析和界面分析。XPS表面分析的优点和特点可以总结如下: ⑴固体样品用量小,不需要进行样品前处理,从而避免引入或丢失元素所造成的错误分析 ⑵表面灵敏度高,一般信息采样深度小于10nm ⑶分析速度快,可多元素同时测定 ⑷可以给出原子序数3-92的元素信息,以获得元素成分分析 ⑸可以给出元素化学态信息,进而可以分析出元素的化学态或官能团 ⑹样品不受导体、半导体、绝缘体的限制等 ⑺是非破坏性分析方法。结合离子溅射,可作深度剖析 目前,XPS主要用于金属、无机材料、催化剂、聚合物、涂层材料、纳米材料、矿石等各种材料的研究,以及腐蚀、摩擦、润滑、粘接、催化、包覆、氧化等过程的研究,也可以用于机械零件及电子元器件的失效分析,材料表面污染物分析等。 14.2 基本原理 XPS方法的理论基础是爱因斯坦光电定律。用一束具有一定能量的X射线照射固体样品,入射光子与样品相互作用,光子被吸收而将其能量转移给原子的某一壳层上被束缚的电子,此时电子把所得能量的一部分用来克服结合能和功函数,余下的能量作为它的动能而发射出来,成为光电子,这个过程就是光电效应。 该过程可用下式表示: hγ=E k+E b+E r(14.1) 式中: hγ:X光子的能量(h为普朗克常数,γ为光的频率); 射线数字成像技术的应用 在管道建设工程中,射线检测是确保焊接质量的主要无损检测手段,直接关系到工程建设质量、健康环境、施工效率、建设成本以及管线的安全运行。长期以来,射线检测主要采用X射线或γ射线的胶片成像技术,检测劳动强度大,工作效率较低,常常影响施工进度。 近年来随着计算机数字图像处理技术及数字平板射线探测技术的发展,X射线数字成像检测正逐渐运用于容器制造和管道建设工程中。数字图像便于储存,检索、统计快速方便,易于实现远程图像传输、专家评审,结合GPS系统可对每道焊口进行精确定位,便于工程质量监督。同时,由于没有了底片暗室处理环节,消除了化学药剂对环境以及人员健康的影响。 过大量的工程实践与应用,对管道焊缝射线数字化检测与评估系统进行了应用研究分析探索。 1 射线数字成像技术的应用背景 随着我国经济的快速发展,对能源的需求越来越大,输油输气管道建设工程也越来越多,众多的能源基础设施建设促进了金属材料焊接技术及检测技术的进步。 目前,在管道建设工程中,管道焊接基本实现了自动化和半自动化,而与之配套的射线检测主要采用胶片成像技 术,检测周期长、效率低下。“十二五”期间,将有更多的油气管道建设工程相继启动,如何将一种可靠的、快速的、“绿色”的射线数字检测技术应用于工程建设中,以替代传统射线胶片检测技术已成为目前管道焊缝射线检测领域亟需解决的问题。 2 国内外管道焊缝数字化检测的现状 2.1 几种主要的射线数字检测技术 1)CCD型射线成像(影像增强器) 2)光激励磷光体型射线成像(CR) 3)线阵探测器(LDA)成像系统 4)平板探测器(FPD)成像系统 几种技术各有特点,目前适用于管道工程检测的是CR 和FPD,但CR不能实时出具检测结果,且操作环节较繁琐、成本较高,因此平板探测器成像系统成为射线数字检测的主要发展方向。 2.2 国内研发情况 国内目前从事管道焊缝射线数字化检测系统研发的机构主要有几家射线仪器公司,但其产品主要用于钢管生产厂的螺旋焊缝检测。通过实践应用比较,研究应用电子学研究所研发的基于平板探测器的管道焊接射线数字化检测与评估系统已能够满足管道工程检测需要,并通过了科技成果鉴 全固态锂电池技术的研究进展与展望 周俊飞 (衢州学院化学与材料工程学院浙江衢州324000) 摘要:现有电化学储能锂离子电池系统采用液体电解质,易泄露、易腐蚀、服役寿命短,具有安全隐患。薄膜型 全固态锂电池、大容量聚合物全固态锂电池和大容量无机全固态锂电池是一类以非可燃性固体电解质取代传统锂离 子电池中液态电解质,锂离子通过在正负极间嵌入-脱出并与电子发生电荷交换后实现电能与化学能转换的新型高 安全性锂二次电池。作者综述了各种全固态锂电池的研究和开发现状,包括固态锂电池的构造、工作原理和性能特 征,锂离子固体电解质材料与电极/电解质界面调控,固态整电池技术等方面,提出并详细分析了该技术面临的主要 科学与技术问题,最后指出了全固态锂电池技术未来的发展趋势。 关键词:储能;全固态锂离子电池;固体电解质;界面调控 1 全固态锂电池概述 全固态锂二次电池,简称为全固态锂电池,即电池各单元,包括正负极、电解质全部采用固态材料的锂二次电池,是从20 世纪50 年代开始发展起来的[10-12]。全固态锂电池在构造上比传统锂离子电池要简单,固体电解质除了传导锂离子,也充当了隔膜的角色,如图 2 所示,所以,在全固态锂电池中,电解液、电解质盐、隔膜与黏接剂聚偏氟乙烯等都不需要使用,大大简化了电池的构建步骤。全固态锂电池的工作原理与液态电解质锂离子电池的原理是相通的,充电时正极中的锂离子从活性物质的晶格中脱嵌,通过固体电解质向负极迁移,电子通过外电路向负极迁移,两者在负极处复合成锂原子、合金化或嵌入到负极材料中。放电过程与充电过程恰好相反,此时电子通过外电路驱动电子器件。目前,对于全固态锂二次电池的研究,按电解区分主要包括两大类[13]:一类是以有机聚合物电解质组成的锂离子电池,也称为聚合物全固态锂电池;另一类是以无机固体电解质组成的锂离子电池,又称为无机全固态锂电池,其比较见表1。通过表1 的比较可以清楚地看到,聚合物全固态锂电池的优点是安全性高、能够制备成各种形状、通过卷对卷的方式制备相对容易,但是,该类电池作为大容量化学电源进入储能领域仍有一段距离,主要存在的问题包括电解质和电极的界面不稳定、高分子固体电解质容易结晶、适用温度范围窄以及力学性能有提升空间;以上问题将导致大容量电池在使用过程中因为局部温度升高、界面处化学反应面使聚合物电解质开貌发生变化,进而增大界面电阻甚至导致断路。同时,具有隔膜作用的电解质层的力学性能的下降将引起电池内部发生短路,从面使电池失效[14-15]。无机固体电解质材料具有机械强度高,不含易燃、易挥发成分,不存在漏夜,抗温度性能好等特点;同时,无机材料处理容易实现大规模制备以满足大尺寸电池的需要,还可以制备成薄膜,易于将锂电池小型化,而且由无机材料组装的薄膜无机固体电解质锂电池具有超长的储存寿命和循环性能,是各类微型电子产品电源的最佳选择[10]。采用有机电解液的传统锂离子电池,因过度充电、内部短路等异常时电解液发热,有自燃甚至爆炸的危险(图3)。从图 3 可以清楚地看到,当电池因为受热或短路情况下导致温度升高后,传统的锰酸锂或钴酸锂液体电解质锂离子电池存在膨胀起火的危险,而基于纯无机材料的全固态锂电池未发生此类事故。这体现了无机全固态锂电池在安全性方面的独特优势。以固体电解质替代有机液体电解液的全固态锂电池,在解决传统锂离子电池能量密度偏低和使用寿命偏短这两个关键问题的同时,有望彻底解决电池的安全性问题,符合未来大容量新型化学储能技术发展的方向。正是被全固态锂电池作为电源所表现出来的优点所吸引,近年来国际上对全固态锂电池的开发和研究逐渐开始活跃[10-12] 2 全固态锂电池储能应用研究进展 在社会发展需求和潜在市场需求的推动下,基于新概念、新材料和新技术的化学储能新体系不断涌现,化学储能技术正向安全可靠、长寿命、大规模、低成本、无污染的方向发展。目前已开发的化学储能装置,包括各种二次电池(如镍氢电池、锂离子电池等)、超级电容器、可再生燃料电池(RFC:电解水制氢-储氢-燃料电池发电)、钠硫电池、液流储能电池等。综合各种因素,考虑用于大规模化学储能的主要是锂二次电池、钠硫电池及液流电池,而其中大容量储能用锂二次电池更具推广前景。。 全固态锂电池、锂硫电池、锂空气电池或锂金属电池等后锂离子充电电池的先导性研究在世界各地积极地进行着,计划在2020 年前后开始商业推广。在众多后锂离子充电电池中,包括日本丰田汽车、韩国三星电子和德国KOLIBRI 电池公司对全固态锂电池都表现出特别的兴趣。图 4 为未来二十年大容量锂电池的发展路径,从图 4 可以看出,全固态电 X射线荧光光谱分析 X射线是一种电磁辐射,其波长介于紫外线和γ射线之间。它的波长没有一个严格的界限,一般来说是指波长为0.001-50nm的电磁辐射。对分析化学家来说,最感兴趣的波段是0.01-24nm,0.01nm左右是超铀元素的K系谱线,24nm则是最轻元素Li的K系谱线。1923年赫维西(Hevesy, G. Von)提出了应用X射线荧光光谱进行定量分析,但由于受到当时探测技术水平的限制,该法并未得到实际应用,直到20世纪40年代后期,随着X射线管、分光技术和半导体探测器技术的改进,X荧光分析才开始进入蓬勃发展的时期,成为一种极为重要的分析手段。 1.1 X射线荧光光谱分析的基本原理 当能量高于原子内层电子结合能的高能X射线与原子发生碰撞时,驱逐一个内层电子而出现一个空穴,使整个原子体系处于不稳定的激发态,激发态原子寿命约为10-12-10-14s,然后自发地由能量高的状态跃迁到能量低的状态。这个过程称为驰豫过程。驰豫过程既可以是非辐射跃迁,也可以是辐射跃迁。当较外层的电子跃迁到空穴时,所释放的能量随即在原子内部被吸收而逐出较外层的另一个次级光电子,此称为俄歇效应,亦称次级光电效应或无辐射效应,所逐出的次级光电子称为俄歇电子。它的能量是特征的,与入射辐射的能量无关。当较外层的电子跃入内层空穴所释放的能量不在原子内被吸收,而是以辐射形式放出,便产生X射线荧光,其能量等于两能级之间的能量差。因此,X射线荧光的能量或波长是特征性的,与元素有一一对应的关系。图1-1给出了X射线荧光和俄歇电子产生过程示意图。 K层电子被逐出后,其空穴可以被外层中任一电子所填充,从而可产生一系列的谱线,称为K系谱线:由L层跃迁到K层辐射的X射线叫Kα射线,由M层跃迁到K层辐射的X射线叫Kβ射线……。同样,L层电子被逐出可以产生L系辐射(见图1-2)。 全固态3D薄膜锂离子电池的研究进展 作者:邓亚锋钱怡崔艳华刘效疆来源:本站浏览数:289 发布时间:2013-8-8 16:28:16 0 引言 全固态薄膜锂离子电池主要由正/负极薄膜、电解质和集流器薄膜组成.整个电池厚约10 μm,可设计成任意形状和大小集成在IC电路中,是便携式电子设备、微电子机械系统(MEMS)以及微型国防技术装备(如微型智能武器)的理想能源。全固态平面薄膜电池(图1)受限于几何结构,能量和功率密度难以满足快速发展的MEMS、微型医疗器械、无线通信、传感器等领域对微电源的要求。全固态三维薄膜锂离子电池(简称3D锂电池)通过独特的构架设计(图2),增大单位立足面积内电极活性物质负载量,并缩短锂离子扩散半径,提高了电池的容量和充放电速率。是解决未来微电子器件能量需求的一种有效方式,引起了人们的极大关注。 1 不同构架的全固态3D薄膜锂电池 1.1 叉指碳柱3D电池 叉指碳柱3D电池由加利福尼亚大学Wang小组于2004年首次提出(图3),在Si/SiO2衬底上涂覆感光胶,光刻得到图形,再经过高温热解及后处理,即制得正/负极叉指状碳柱3D电池。叉指碳柱既可以直接作为电极,又可以作为集流器,在其表面沉积各种电化学活性物质。2008年,Min等研究了在叉指碳柱上电镀十二烷基苯磺酸盐掺杂聚吡咯(PPYDBS)导电聚合物薄膜的方法。结果表明,覆盖约10 μm厚PPYDBS的叉指阴极(C-PPYDBS),电极电位从碳电极的3.2 V提高到了3.7 V(相对于Li/Li+),但自放电较为严重,电池的放电容量远小于充电电容。 为改善叉指碳柱电极性能,Teixidor等制备出包覆中间相碳微球的叉指碳柱(C-MCMB),有效提高了电极不可逆容量,但可逆容量仍较低。Chen等在叉指碳柱上包覆碳纳米管(CNT/C-MEMS)使单位立足面积电容达到8.3 F/cm2,充放电循环性能得到显著提高。 叉指碳柱电极成本低、热力学和化学稳定性好、易制成各种形貌、能包覆不同的活性材料(图4),光刻-热解工艺较为成熟,适合工业化生产。但是,叉指结构放电不均匀、漏电流较大、碳柱在锂离子嵌入和脱出过程中易变形破损,这些问题需进一步研究解决。 1.2 微通道衬底3D电池 1998年,以色列特拉维夫大学的Peled小组首次报道了微通道衬底3D 电池(3D-MCP);在Si片或玻璃上蚀刻出均匀分布、直径为15~50 μm的微通 论 著8 全固态薄膜锂离子二次电池的研究进展 耿利群任岳*朱仁江陈涛 (重庆师范大学物理与电子工程学院,重庆 400047) 摘 要:本文综述了全固态薄膜锂离子二次电池的研究进展,主要阐述了薄膜锂电池的结构设计以及正极、负极和固体电解质材料研究现状,并对其今后的发展趋势及研发热点进行了展望。 关键词:全固态薄膜锂离子二次电池;固体电解质;电池结构 DOI:10.3969/j.issn.1671-6396.2013.01.004 1 引言 随着电子信息工业和微型加工技术快速发展,对其所需的微型能源则提出了特殊微型化的要求。其中全固态薄膜锂离子二次电池因其高的能量密度、强的安全性、长的循环寿命、宽的工作电压和重量轻等优点,成为微电池系统需求的最佳选择[1]。本文主要介绍了全固态薄膜锂离子二次电池的关键性薄膜材料及电池结构的研究现状,并对其的开发应用及研究前景作了分析。 2 全固态薄膜锂离子二次电池结构的研究 薄膜电池结构的设计,对整个电池性能将产生直接的影响;同样对提高电池的能量密度、循环寿命和锂离子的传输速率也起到至关重要的作用。所以优化薄膜电池结构的设计,则是对构造高性能薄膜锂离子电池做到了强有力的支撑。 1993年美国橡树岭国家实验室(ORNL)Bates等[2]研制出了一种经典的薄膜锂离子电池叠层结构(见图1)。在衬底上先沉积两层阴阳极电流收集极薄膜,而后依次沉积阴极、固体电解质和阳极薄膜,最后在薄膜电池外表面上涂一层保护层,以此来防止阳极上金属锂和空气中的一些物质发生化学反应。 图1 薄膜锂离子电池结构剖面示意图 Baba等[3]研发出另一种典型的薄膜锂离子电池结构(见图2)。其较图1薄膜锂电池结构设计更为简单,制作更为容易。在不锈钢衬底上依次沉积各层薄膜电池材料,而在图示中有两个引线端子则是为了便于薄膜电池的连接使用。这种结构设计很好地提高了整个电池的有效面积,进而也极大地改善了薄膜电池的性能。 Nakazawa等[4]利用直流溅射和射频溅射的方法,研制出一种“直立型”全固态薄膜锂离子电池结构(见图3)。该研究小组利用该薄膜电池结构设计,成功制备出有效面积更大的全固态薄膜锂离子电池,这样也使得薄膜电池的能量密度和循环寿命等电化学性能得到大幅度提升。 图2 全固态薄膜锂离子电池结构剖面示意图 图3 “直立型”全固态薄膜锂离子电池剖面示意图 Hart等[5]设计了柱状电极交替排列的微型锂电池结构(见图4)。并对几种不同的正极、负极排列方式进行了相关的研究计算,得出了此薄膜电池的结构能够大大提升薄膜电池本身的能量密度。然而Eftekhari[6]则研制出了一种3-D微型锂电池结构的LiMn2O4电极,与以往微型锂电池结构的LiMn2O4电极在电池容量方面得到了提升。 图4 3-D微电池柱状结构示意图 [正极(灰色) 、负极(白色)交替排列分布] 射线数字成像检测技术 韩焱 (华北工学院现代元损检测技术工程中心,太原030051) 摘要:介绍多种射线数字成像(DR)系统的组成及成像机理,分析其性能指标、优缺点及应用领域。光子放大的DR系统(如图像增强器DR系统)实时性好,但适应的射线能量低,检测灵敏度相对较低;其它系统的检测灵敏度较高但成像时间较长。DR系统成像方式的主要区别在于射线探测器,除射线转换方式外,影响系统检测灵敏度的主要因素是散射噪声和量子噪声;可采用加准直器和光量子积分降噪的方法提高检测灵敏度。 关键词:射线检验;数字成像系统;综述 中图分类号:TGll5.28 文献标识码:A 文章编号:1000-6656(2003109-0468-04 DIGITAL RADIOGRAPHIC TECHNOLOGY HAN Yan (Center of Modern NDT &E, North China Institute of Technology, Taiyuan 030051, China) Abstract: The structure and imaging principle of digital radiographic (DR) systems are introduced. And thecharacteristics, performances, advantages, disadvantages and applications of the systems are analyzed. The DR sys-tern with photon amplification such as the DR system with intensifier can get real-time imaging, but it fits for lowerenergy and its inspection sensitivity is lower. The systems working with high energy can obtain higher sensitivity,while is time-eonsurning. The imaging way of a DR system depends on the detector used, and the factors influencinginspection sensitivity are the quantum noise from ray source and scatter noise besides the transform way of rays.Quantum integration noise reducer and collimator can be used to improve the inspection sensitivity of the system. Keywords:Radiography; Digital imaging system; Survey 射线检测技术作为产品质量检测的重要手段,经过百年的历史,已由简单的胶片和荧屏射线照相发展到了数字成像检测。随着信息技术、计算机技术和光电技术等的发展,射线数字成像检测技术也得到了飞速的发展,新的射线数字成像方法不断涌现,给射线探伤赋予了更广泛的内涵,同时也使利用先进网络技术进行远程评片和诊断成为可能。 目前工业中使用的射线数字成像检测技术主要包括射线数字直接成像检测技术(Digital Radio—graphy,简称DR)和射线数字重建成像检测技术,如工业CT(Industry Computed Tomography,简称ICT)。以下将在介绍DR检测系统组成的基础上,重点分析系统的成像原理、特点、特性及应用场合。 1 DR检测系统简介 DR检测系统组成见图1。按照图像的成像方式分为线扫描成像和面扫描成像;根据成像过程可分为直接和间接式DR系统。以下重点介绍直接DR系统。 图1 DR检测系统组成框图 1.1 直接式DR系统 直接DR成像系统主要分为图像增强器成像系统、平板型成像系统和线阵扫描成像系统等。 图2为图像增强器式DR系统,主要通过射线视频系统与数字图像处理系统集成实现。系统采用射线--可见光--电子--电子放大--可见光的光放大技术,是将射线光子由转换效率较高的主射线转换屏转换为可见光图像,可见光光子经光电转换变为电子,而后对电子进行放大,放大后的电子聚集在小屏上再次 能源材料课程业 ——薄膜锂电池的研究进展 院系:材料科学与工程学院 专业:金属材料与成型加工 班级:2012级金属材成1班 学号:20120800828 姓名:吴贵军 薄膜锂电池的研究进展 摘要:微电子机械系统(MEMS)和超大规模集成电路(VLSI)技术的发展对能源的微型化、集成化提出了越来越高的要求.全固态薄膜锂电池因其良好的集成兼容性和电化学性能成为MEMS和VLSI能源微型化、集成化的最佳选择.简单介绍了薄膜锂电池的构造,举例说明了薄膜锂电池的工作原理.从阴极膜、固体电解质膜、阳极膜三个方面概述了近年来薄膜锂电池关键材料的研究进展.阴极膜方面LiCoO2依旧是研究的热点,此外对LiNiO2、LiMn2O4、LiNixCo1-xO2、V2O5也有较多的研究;固体电解质膜方面以对LiPON膜的研究为主;阳极膜方面以对锂金属替代物的研究为主,比如锡的氮化物、氧化物以及非晶硅膜,研究多集中在循环效能的提高.在薄膜锂电池结构方面,三维结构将是今后研究的一个重要方向.。 关键词:薄膜锂电池;微系统;薄膜:微电子机械系统随着电子集成技术的飞速发展,SO C (System on chi p) 成为 现实,电子产品在不断地小型化、微型化。以整合集成电路及机械系统,如各种传感器于同一块晶片上的技术,即微机电技术,受到了普遍重视。微小型飞行器、微小型机器人和微小型航天器等都在源源不断地出现和进一步地改进。这些微型系统的功能强大,必然对其能源系统提出了微型化的 要求。当电池系统被微型化,电池底面积小于10 m m2、功率在微瓦级以下时,被称为微电池。微电池的制备通常是将传统的电池微型化、薄膜化。目前,用于微电池的体系有:锌镍电池、锂电池、太阳能电池、燃料电池、温差电池和核电池。锂电池是目前具有较高比能量的实用电池体系,因此人们对薄膜化的锂电池投入了大量的研究。 优点: (1)成本低,根据Photon 的预测,预计到2012 年下降到2.08 美元/w;预计薄膜电池的平均价格能够从2.65 美元/w 降至1.11 美元/w,与晶体硅相比优势明显;而相关薄膜电池制造商的预测更加乐观,EPV 估计到2011 年,薄膜组件的成本将大大低于1 美元/w;Oerlikon 更估计2011 年GW 级别的电站其组件成本将降低于0.7 美元/w,这主要是由转化率提高和规模化带来的。 (2)弱光性好 (3)适合与建筑结合的光伏发电组件(BIPV),不锈钢和聚合物衬底的柔性薄膜太阳能电池适用于建筑屋顶等,根据需要制作成不同的透光率,代替玻璃幕墙。 缺点: (1)效率低,单晶硅太阳能电池,单体效率为14%-17%(AMO),而柔性基体非晶硅太阳电池组件(约1000平方厘米)的效率为 10-12%,还存在一定差距。 实用标准文档 X射线数字成像检测系统 目录 一、目的意义 (3) 二、系统介绍 (3) 2.1 CR 技术与 DR技术的共同点 (4) 2.2 CR 技术与 DR技术的不同点 (4) 2.3 对比分析 (5) 2.4 系统组成 (5) 2.5 X 射线数字平板探测器 (6) 2.6 X 射线源 (7) 2.7 图像处理系统 (8) 2.8 成像板扫描仪 (9) 2.9IP 成像板 (9) 三、 DR检测案例 (10) 3.1 广西 220kV 振林变 (10) 3.2 广西 220kV 水南变 (11) 3.3 温州 220kV 白沙变 (13) 3.4 广西 110kV 城东变 (15) 3.5 广西乐滩水电站 (16) 四、 CR检测案例 (18) 4.1 百色茗雅 220kV变电站 (18) 一、目的意义 气体绝缘全封闭组合电器(GIS)设备结构复杂,由断路器、隔离开关、接 地开关、互感器、避雷器、母线、连接件和出线终端等组成,内部充有SF6绝缘气体,给解体检修工作带来很大的困难,且检修工作技术含量高,耗时长,停电 所造成的损失大。通过对 GIS 设备事故的分析发现,大部分严重事故,未能通过现有的检测手段在缺陷发展初期被发现,导致击穿、烧损等严重事故的发生。 通过 GIS 设备局放监测,结合专家数据库和现场经验,可大致判断 GIS 设备局放类型,进行大致的定位,但无法明确GIS 设备内部的具体故障。结合X 射线数字成像检测系统,对 GIS 设备进行多方位透视成像,配合专用的图像处理与 判读技术,实现其内部结构的“可视化”与质量状态快速诊断,极大地提高 GIS 设备故障定位与判别的准确性,提高故障诊断效率,为整个设备的运行安全与质量监控提供一种全新的检测手段。对 GIS 设备局放可能造成的危害及其影响范围和程度,提出相应策略,采取相应的措施,对电网的安全、稳定、经济运行具有重要意义。 二、系统介绍 按照读出方式(即X 射线曝光到图像显示过程)不同,可分为: 数字射线成像( DR-Digital Radiography) 计算机射线成像( CR-Computed Radiography) 图 1-1 检测原理图 一、X光电子能谱分析的基本原理 X光电子能谱分析的基本原理:一定能量的X光照射到样品表面,和待测物质 发生作用,可以使待测物质原子中的电子脱离原子成为自由电子。该过程可用 下式表示: hn=Ek+Eb+Er (1) 其中:hn:X光子的能量;Ek:光电子的能量;Eb:电子的结合能;Er:原子的 反冲能量。其中Er很小,可以忽略。 对于固体样品,计算结合能的参考点不是选真空中的静止电子,而是选用费米 能级,由内层电子跃迁到费米能级消耗的能量为结合能Eb,由费米能级进入真 空成为自由电子所需的能量为功函数Φ,剩余的能量成为自由电子的动能Ek,式(1)又可表示为: hn=Ek+Eb+Φ(2) Eb=hn-Ek-Φ(3)仪器材料的功函数Φ是一个定值,约为 4 eV,入射X光子能量已知,这样, 如果测出电子的动能Ek,便可得到固体样品电子的结合能。各种原子,分子的 轨道电子结合能是一定的。因此,通过对样品产生的光子能量的测定,就可以 了解样品中元素的组成。元素所处的化学环境不同,其结合能会有微小的差别,这种由化学环境不同引起的结合能的微小差别叫化学位移,由化学位移的大小 可以确定元素所处的状态。例如某元素失去电子成为离子后,其结合能会增加,如果得到电子成为负离子,则结合能会降低。因此,利用化学位移值可以分析 元素的化合价和存在形式。 二、电子能谱法的特点 (1)可以分析除H和He以外的所有元素;可以直接测定来自样品单个能级光电 发射电子的能量分布,且直接得到电子能级结构的信息。(2)从能量范围看,如果把红外光谱提供的信息称之为“分子指纹”,那么电子能谱提供的信息可称 作“原子指纹”。它提供有关化学键方面的信息,即直接测量价层电子及内层 电子轨道能级。而相邻元素的同种能级的谱线相隔较远,相互干扰少,元素定 性的标识性强。 (3)是一种无损分析。 (4)是一种高灵敏超微量表面分析技术,分析所需试样约10-8g即可,绝对灵敏 【干货】玩转XPS丨案例解析X射线光电子能谱(XPS)八大应用! 表面分析技术 (Surface Analysis)是对材料外层(the Outer-Most Layers of Materials (<100nm))的研究的技术。 X射线光电子能谱简单介绍 XPS是由瑞典Uppsala大学的K. Siegbahn及其同事历经近20年的潜心研究于60年代中期研制开发出的一种新型表面分析仪器和方法。鉴于K. Siegbahn教授对发展XPS领域做出的重大贡献,他被授予1981年诺贝尔物理学奖。 X射线激发光电子的原理 XPS现象基于爱因斯坦于1905年揭示的光电效应,爱因斯坦由于这方面的工作被授予1921年诺贝尔物理学奖; X射线是由德国物理学家伦琴(Wilhelm Conrad R?ntgen,l845-1923)于1895年发现的,他由此获得了1901年首届诺贝尔物理学奖。 X射线光电子能谱(XPS ,全称为X-ray Photoelectron Spectroscopy)是一种基于光电效应的电子能谱,它是利用X射线光子激发出物质表面原子的内层电子,通过对这些电子进行能量分析而获得的一种能谱。 这种能谱最初是被用来进行化学分析,因此它还有一个名称,即化学分析电子能谱(ESCA,全称为Electron Spectroscopy for Chemical Analysis)。XPS谱图分析中原子能级表示方法 XPS谱图分析中原子能级的表示用两个数字和一个小字母表示。例如:3d5/2(1)第一个数字3代表主量子数(n); (2)小写字母代表角量子数; (3)右下角的分数代表内量子数j X射线数字成像检测系统X射线数字成像检测系统 (XYG-3205/2型) 一、设备基本说明 X射线数字成像系统主要是由高频移动式(固定式)X射线探伤机、数字平板成像系统、计算机图像处理系统、机械电气系统、射线防护系统等几部分组成的高科技产品。它主要是依靠X射线可以穿透物体,并可以储存影像的特性,进而对物体内部进行无损评价,是进行产品研究、失效分析、高可靠筛选、质量评价、改进工艺等工作的有效手段。 探伤机中高压部分采用高频高压发生器,主机频率40KHz为国际先进的技术指标。连续工作的高可靠性,透照清晰度高,穿透能力强,寿命长,故障率低等特点。X光机通过恒功率控制持续输出稳定的X射线,波动小,保证了优质的图像质量。高频技术缩短了开关机时间,有助于缩短检测周期,提高工作效率。 数字平板成像采用美国VEREX公司生产的Paxscan2530 HE型平板探测器,成像效果清晰。该产品已经在我公司生产的多套实时成像产品中使用,性能稳定可靠。 计算机图像处理系统是我公司独立自主研制开发的、是迄今为止国内同行业技术水平最高的同类产品。主要特点是可以根据不同行业用户的需求,编程不同的应用界面及图像处理程序,利用高性能的编程技术,使操作界面简单易懂,最大限度的减少操作步骤,最快速度的达到操作人员的最终需求。 机械传动采用电动控制、无极变速,电气控制采用国际上流行的钢琴式多功能操作台,将本系统中的X射线机控制、工业电视监视、机械操作等集中到一起,操作简单、方便。 该系统的自动化程度高, 检测速度快,极大地提高了射线探伤的效率,降低了检验成本,检测数据易于保存和查询等优点,其实时动态效果更是传统拍片法所无法实现的,多年来该系统已成功应用于航空航天、军事工业、兵器工业、石油化工、压力容器、汽车工业、造船工业、锅炉制造、制管行业、耐火材料、低压铸造、陶瓷行业、环氧树脂材料等诸多行业的无损检测中。 射线数字成像技术发展 摘要:射线数字成像是一种先进辐射成像技术,是辐射成像技术的重要发展方向,该技术利用射线观察物体内部的技术。这种技术可以在不破坏物体的情况下获得物体内部的结构和密度等信息,并且通过计算机进行图像处理和判定。目前已经广泛应用于医疗卫生、国民经济、科学究等领域。 关键词:辐射成像射线数字成像 1引言 自德国物理学家伦琴1895年发现X射线以来,射线无损探伤作为一种常规的无损检测方法在工业领域应用已有近百年的历史,人们一直使用胶片记录X(γ)射线穿过被检物件后的影像,其中60多年来,则一直使用增感屏配合胶片来获取高品质的影像,曝光过后的胶片经过化学处理,产生可视的影像后,在观片灯上显示出来以供读取、分析及判断。胶片-增感屏系统可使射线检测人员实现对影像的采集、显示和存储。这种方法操作简单,产生的图像质量优异,功能效用全面,因此该技术在包括核工业在内的工业、医疗领域一直被广泛使用。 胶片照相法的不足在于检测周期长,因为需要暗室处理,检测周期在3~20个小时不等;大量底片造成保存上的困难,查阅不便;胶片成本高;曝光时间长;在大量的检测工作面前,需要大量人力资源;底片难以共享,某些焊缝底片在需要专家共同研讨评定时,该弊端特别明显;不利于环境保护等。无法满足目前工业化生产和竞争日益激烈的需要。 随着科学技术和设备制造能力的进步,例如电子技术、光电子技术、数字图像处理技术的发展;高亮度高分辨率显示器的诞生;高性能计算机/工作站的广泛应用;计算机海量存储、宽带互联网的发展,使得数字成像技术挑战传统胶片成像方式在技术上形成可能。 以射线DR、CR和CT为代表的数字射线成像技术,结合远程评定技术将是无损检测技术领域的一次革命。数字射线照相技术具有检测速度快,图像保存方便,容易实现远程分析和判断,是未来射线检测发展的方向[1]。(完整版)X射线光电子能谱分析(XPS)
射线数字成像专业书籍
锂离子电池研究现状
X射线光电子能谱仪
光电子能谱分析法基本原理
射线数字成像技术的应用
(完整版)全固态锂电池技术的研究进展与展望
X射线荧光光谱分析基本原理
全固态3D薄膜锂离子电池的研究进展
全固态薄膜锂离子二次电池的研究进展
射线数字成像检测技术
薄膜锂电池
X射线数字成像检测系统郑金泉.doc
X射线光电子能谱(XPS)谱图分析
案例解析X射线光电子能谱(XPS)八大应用!
X射线数字成像检测系统
射线数字成像技术发展