Oracle培训讲义(性能分析与调整)
性能分析与调整1.Oracle的SQL执行计划
2.Auto_trace
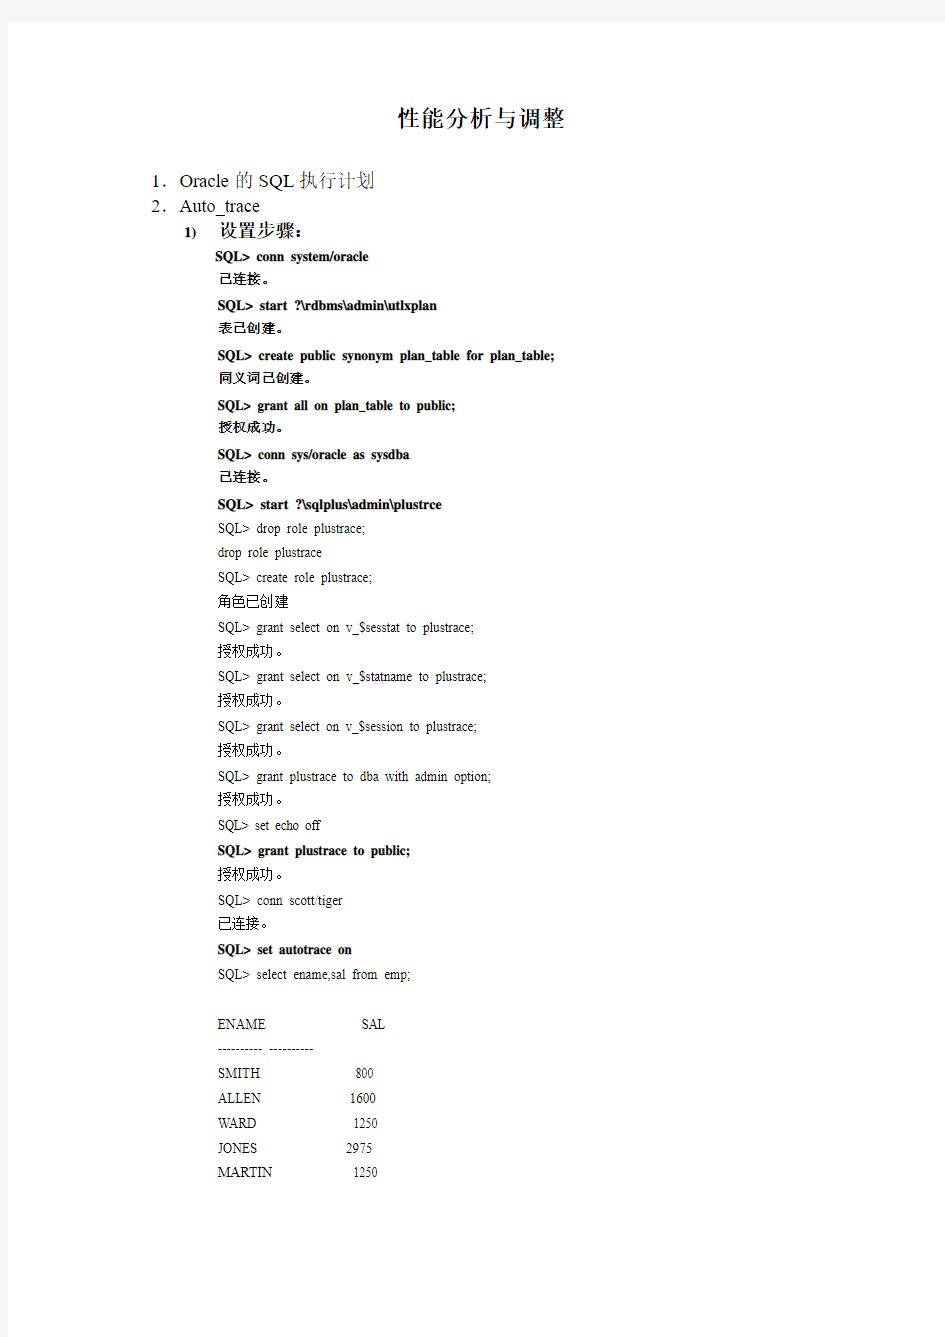
1)设置步骤:
SQL> conn system/oracle
已连接。
SQL> start ?\rdbms\admin\utlxplan
表已创建。
SQL> create public synonym plan_table for plan_table;
同义词已创建。
SQL> grant all on plan_table to public;
授权成功。
SQL> conn sys/oracle as sysdba
已连接。
SQL> start ?\sqlplus\admin\plustrce
SQL> drop role plustrace;
drop role plustrace
SQL> create role plustrace;
角色已创建
SQL> grant select on v_$sesstat to plustrace;
授权成功。
SQL> grant select on v_$statname to plustrace;
授权成功。
SQL> grant select on v_$session to plustrace;
授权成功。
SQL> grant plustrace to dba with admin option;
授权成功。
SQL> set echo off
SQL> grant plustrace to public;
授权成功。
SQL> conn scott/tiger
已连接。
SQL> set autotrace on
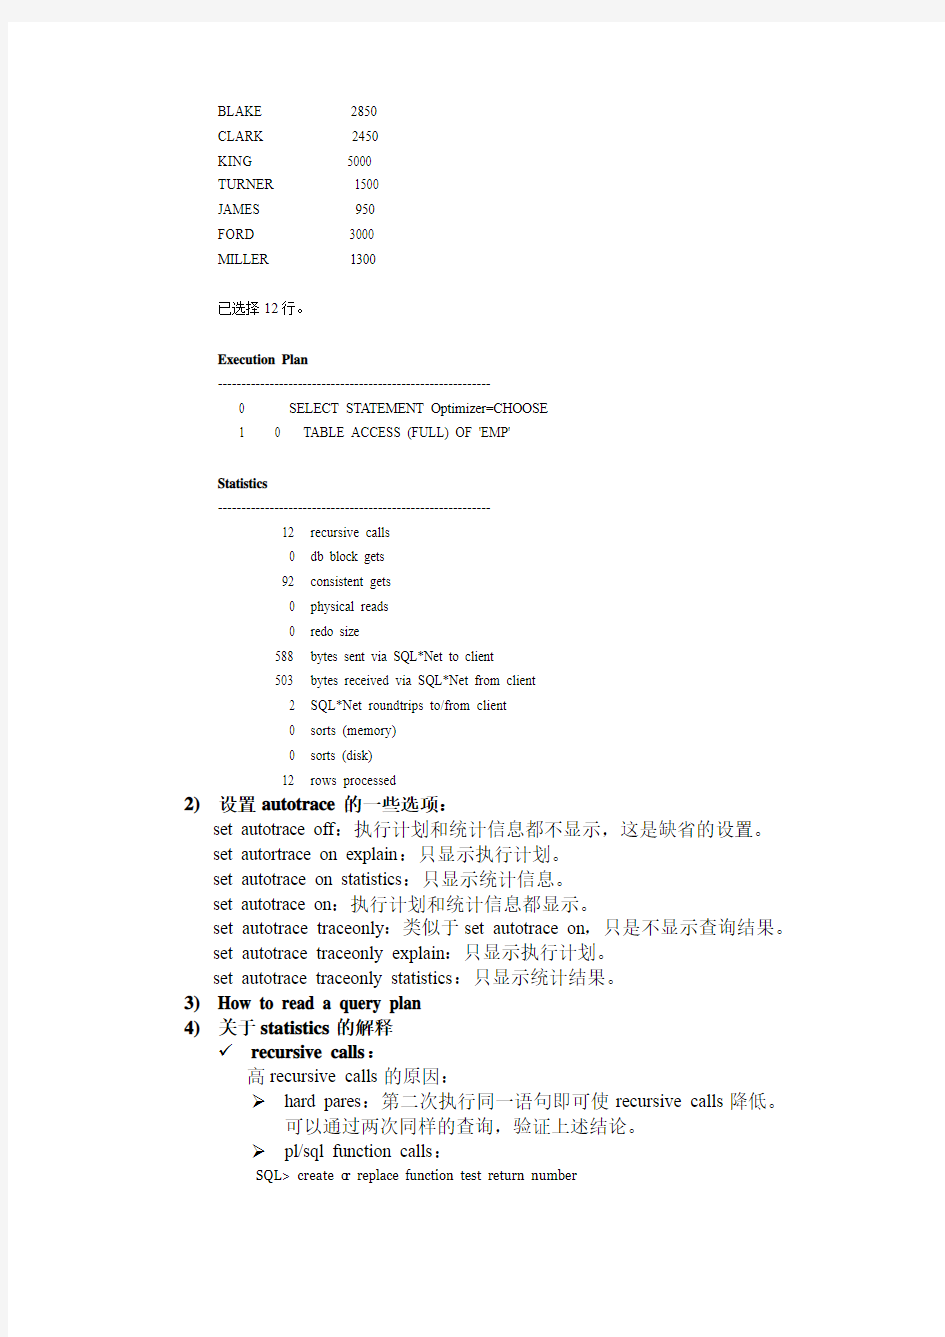
SQL> select ename,sal from emp;
ENAME SAL
---------- ----------
SMITH 800
ALLEN 1600
WARD 1250
JONES 2975
MARTIN 1250
BLAKE 2850
CLARK 2450
KING 5000
TURNER 1500
JAMES 950
FORD 3000
MILLER 1300
已选择12行。
Execution Plan
----------------------------------------------------------
0 SELECT STATEMENT Optimizer=CHOOSE
1 0 TABLE ACCESS (FULL) OF 'EMP'
Statistics
----------------------------------------------------------
12 recursive calls
0 db block gets
92 consistent gets
0 physical reads
0 redo size
588 bytes sent via SQL*Net to client
503 bytes received via SQL*Net from client
2 SQL*Net roundtrips to/from client
0 sorts (memory)
0 sorts (disk)
12 rows processed
2)设置autotrace的一些选项:
set autotrace off:执行计划和统计信息都不显示,这是缺省的设置。
set autortrace on explain:只显示执行计划。
set autotrace on statistics:只显示统计信息。
set autotrace on:执行计划和统计信息都显示。
set autotrace traceonly:类似于set autotrace on,只是不显示查询结果。
set autotrace traceonly explain:只显示执行计划。
set autotrace traceonly statistics:只显示统计结果。
3)How to read a query plan
4)关于statistics的解释
?recursive calls:
高recursive calls的原因:
hard pares:第二次执行同一语句即可使recursive calls降低。
可以通过两次同样的查询,验证上述结论。
pl/sql function calls:
SQL> create o r replace function test return number
2 as
3 l_cnt number;
4 begin
5 select co unt(*) into l_cnt fro m dept;
6 return l_cnt;
7end;
8/
函数已创建。
SQL> select ename,test fro m emp;
ENAME TEST
---------- ----------
SMITH 6
ALLEN 6
WARD 6
JONES 6
MARTIN 6
BLAKE 6
CLARK 6
KING 6
TURNER 6
JAMES 6
FORD 6
MILLER 6
已选择12行。
Executio n Plan
--------------------------------------------------------
0 SELECT STATEMENT Optimizer=CHOOSE
10 TABLE ACCESS (FULL) OF 'EMP'
Statistics
--------------------------------------------------------
284 recursive calls
0 db block gets
144 consistent gets
6 physical reads
136 redo size
579 bytes sent via SQL*Net to client
503 bytes recei ved via SQL*Net fro m client
2 SQL*Net roundtrips to/fro m client
9 so rts (memo ry)
0 sorts (disk)
12 ro ws processed
SQL> /
ENAME TEST
---------- ----------
SMITH 6
ALLEN 6
WARD 6
JONES 6
MARTIN 6
BLAKE 6
CLARK 6
KING 6
TURNER 6
JAMES 6
FORD 6
MILLER 6
已选择12行。
Executio n Plan
--------------------------------------------------------
0 SELECT STATEMENT Optimizer=CHOOSE
10 TABLE ACCESS (FULL) OF 'EMP'
Statistics
--------------------------------------------------------
12 recursive calls
0 db block gets
92 consistent gets
0 physical reads
0 redo size
579 bytes sent via SQL*Net to client
503 bytes recei ved via SQL*Net fro m client
2 SQL*Net roundtrips to/fro m client
0 sorts (memo ry)
0 sorts (disk)
12 ro ws processed
side effect from modification:由于triggers、基于函数的索引引起。
space request:DMT表空间中的表要求空间时,会引起较多的recursive calls,通过使用LMT,可以显著减少这种recursive calls,
而LMT中的recursive calls主要是由于验证quota权限引起。可
以通过实验验证上面的说法(实验步骤见Effective Oracle by
Design pp101)。
?db block gets and consistent gets
db block get是以current mode读取的数据块数,通常是由于数据修改而引起,consistent gets是以consistent mode读取的数据块数,通常由于select操作引起。我们关注的是这两个数量之和,即逻辑I/O 的数量,逻辑I/O也代表了对缓存加上latch的数量,逻辑I/O越少,
越好。The less logical I/O we can do,the better。我们可以通过设置合适的arraysize(许多方法中的一个,适用于sql*plus)来降低逻辑I/O 数量,ODBC,JDBC也有类似的设置。
Array size:
SQL> conn system/o racle@catalog
已连接。
SQL> grant dba to scott;
授权成功。
SQL> conn scott/tiger@catalog
已连接。
SQL> drop table t;
表已丢弃。
SQL> create table t
2 as
3 select * fro m all_objects;
表已创建。
SQL> select co unt(*) fro m t;
COUNT(*)
----------
6219
已选择6219行。
SQL> set auto trace traceo nly statistics
SQL> select * fro m t;
已选择6219行。
Statistics
------------------------------------------------------
0 recursive calls
0 db block gets
491 consistent gets
0 physical reads
0 redo size
357171 bytes sent via SQL*Net to client
5057 bytes received via SQL*Net fro m client
416 SQL*Net roundtrips to/fro m client
0 sorts (memo ry)
0 sorts (disk)
6219 rows processed
SQL> sho w arraysize
arraysize 15
SQL> set arraysize 2
SQL> select *fro m t;
已选择6219行。
Statistics
----------------------------------------------------
0 recursive calls
0 db block gets
3156 consistent gets
0 physical reads
0 redo size
683239 bytes sent v ia SQL*Net to client
34702 bytes received via SQL*Net fro m client
3111 SQL*Net ro undtrips to/fro m client
0 sorts (memo ry)
0 sorts (disk)
6219 rows processed
SQL> set arraysize 4
SQL> /
已选择6219行。
Statistics
----------------------------------------------------
0 recursive calls
0 db block gets
1618 co nsistent gets
0 physical reads
0 redo size
495111 bytes sent via SQL*Net to client
17597 bytes received via SQL*Net fr o m client
1556 SQL*Net roundtrips to/fro m client
0 sorts (memo ry)
0 sorts (disk)
6219 rows processed
SQL> set arraysize 8
SQL> /
已选择6219行。
Statistics
------------------------------------------------------
0 recursive calls
0 db block gets
853 co nsistent gets
0 physical reads
0 redo size
401094 bytes sent via SQL*Net to client
9050 bytes received via SQL*Net fro m client
779 SQL*Net ro undtrips to/fro m client
0 sorts (memo ry)
0 sorts (disk)
6219 rows processed
SQL> set arraysize 16
SQL> /
已选择6219行。
Statistics
------------------------------------------------------
0 recursive calls
0 db block gets
465 consistent gets
0 physical reads
0 redo size
354025 bytes sent via SQL*Net to client
4771 bytes received via SQL*Net fro m client
390 SQL*Net roundtrips to/fro m client
0 sorts (memo ry)
0 sorts (disk)
6219 rows processed
phisical reads:指Oracle把数据从硬盘读到内存的次数,也就是读取到内存的数据块数,然后我们执行逻辑I/O从内存读取数据,因此,
一般情况下,物理I/O都跟随着逻辑I/O。
phisical reads分为两种:
reading data in from datafiles:对数据文件读取获得索引数据或者表数据,这种I/O立刻跟随着逻辑I/O。
direct reads from temp:当sort area或hash area不能在内存中容纳sort data或hash data时,Oracle会把部分数据交换到temp表空间,然后再读取,这种读取会越过buffer cache,不会引发逻辑I/O。
第一种物理I/O,我们不能避免,如果在第一次查询后,同样的查询还需要物理I/O,,则可能是因为data buffer cache太小,在物理内存足够的情况下,可以把data buffer cache增大。
对于第二种,我们可以通过设置合适的sort_area_size和hash_area_size大小,来降低phisical reads,注意,在Oracle9i中,要先把workarea_size_policy参数设置为manual,改动sort_area_size 及hash_area_size参数才会生效,8i可以直接设置sort_area_size。SQL> conn scott/tiger@catalog
已连接。
SQL> show parameter work
NAME TYPE V ALUE ------------------------------------ ----------- ------------------------- workarea_size_policy string AUTO
SQL> alter session set workarea_size_policy=manual;
会话已更改。
SQL> alter session set sort_area_size=0;
会话已更改。
SQL> set autotrace traceonly statistics
SQL> select * from t order by object_id;
已选择6219行。
Statistics
----------------------------------------------------------
0 recursive calls
24 db block gets
80 consistent gets
214 physical reads
0 redo size
219216 bytes sent via SQL*Net to client
767 bytes received via SQL*Net from client
26 SQL*Net roundtrips to/from client
0 sorts (memory)
1 sorts (disk)
6219 rows processed
SQL> /
已选择6219行。
Statistics
----------------------------------------------------------
0 recursive calls
22 db block gets
80 consistent gets
212 physical reads
0 redo size
219216 bytes sent via SQL*Net to client
767 bytes received via SQL*Net from client
26 SQL*Net roundtrips to/from client
0 sorts (memory)
1 sorts (disk)
6219 rows processed
SQL> alter session set sort_area_size=1024;
会话已更改。
SQL> select * from t order by object_id;
已选择6219行。
Statistics
----------------------------------------------------------
0 recursive calls
59 db block gets
80 consistent gets
435 physical reads
0 redo size
219216 bytes sent via SQL*Net to client
767 bytes received via SQL*Net from client
26 SQL*Net roundtrips to/from client
0 sorts (memory)
1 sorts (disk)
6219 rows processed
SQL> /
已选择6219行。
Statistics
----------------------------------------------------------
0 recursive calls
59 db block gets
80 consistent gets
437 physical reads
0 redo size
219216 bytes sent via SQL*Net to client
767 bytes received via SQL*Net from client
26 SQL*Net roundtrips to/from client
0 sorts (memory)
1 sorts (disk)
6219 rows processed
SQL> alter session set sort_area_size=102400;
会话已更改。
SQL> select * from t order by object_id;
已选择6219行。
Statistics
----------------------------------------------------------
0 recursive calls
19 db block gets
80 consistent gets
198 physical reads
0 redo size
219216 bytes sent via SQL*Net to client
767 bytes received via SQL*Net from client
26 SQL*Net roundtrips to/from client
0 sorts (memory)
1 sorts (disk)
6219 rows processed
SQL> alter session set sort_area_size=10240000;
会话已更改。
SQL> select * from t order by object_id;
已选择6219行。
Statistics
----------------------------------------------------------
0 recursive calls
0 db block gets
80 consistent gets
0 physical reads
0 redo size
219216 bytes sent via SQL*Net to client
767 bytes received via SQL*Net from client
26 SQL*Net roundtrips to/from client
1 sorts (memory)
0 sorts (disk)
6219 rows processed
SQL> alter session set sort_area_size=0;
会话已更改。
SQL> select * from t order by object_id;
已选择6219行。
Statistics
----------------------------------------------------------
0 recursive calls
22 db block gets
80 consistent gets
212 physical reads
0 redo size
219216 bytes sent via SQL*Net to client
767 bytes received via SQL*Net from client
26 SQL*Net roundtrips to/from client
0 sorts (memory)
1 sorts (disk)
6219 rows processed
?redo size
主要在bulk insert操作(CTAS及insert…select)时需要调整,一般的
merge、insert、delete、update语句我们不能控制其redo大小。在归
档模式下,要把表设置为nologging,insert数据时,加上append提
示。
alter table test_redo nologging;
insert /*+ append */ into test_redo select * from all_objects;
非归档模式,不需要把表设置为nologging,只要加上append提示,
也会降低redo size的大小。
如果表建有索引,则要把索引停用,否则依然有大量的redo:
alter index idx_test unusable;
alter session set skip_unusable_indexes=true;
alter index idx_test rebuild nologging;
?sql*net statistics
?sorts and rows processed
3.SQL_TRACE的使用方法
1)设置步骤:
SQL> conn system/oracle
SQL> alter system set sql_trace=true scope=spfile;
SQL> alter system set timed_statistics=true;
SQL> conn sys/oracle as sysdba
SQL> startup force
SQL> grant dba to scoott;
SQL> conn scott/tiger
SQL> select * from dept;
SQL> select a.spid from v$process a,v$session b
2 where a.addr=b.paddr
3 and b.audsid=userenv('sessionid')
4 /
SPID
------------
2756
C:\>tkprof e:\oracle\admin\oemrep\udump\oemrep_ora_2756.trc c:\report.txt
2)报告内容:
TKPROF: Release 9.2.0.1.0 - Production on 星期二2月17 21:12:16 2004
Copyright (c) 1982, 2002, Oracle Corporation. All rights reserved.
Trace file: e:\oracle\admin\oemrep\udump\oemrep_ora_2756.trc
Sort options: default
******************************************************************************** count = number of times OCI procedure was executed
cpu = cpu time in seconds executing
elapsed = elapsed time in seconds executing
disk = number of physical reads of buffers from disk
query = number of buffers gotten for consistent read
current = number of buffers gotten in current mode (usually for update)
rows = number of rows processed by the fetch or execute call
********************************************************************************
select *
from
dept
call count cpu elapsed disk query current rows ------- ------ -------- ---------- ---------- ---------- ---------- ---------- Parse 1 0.00 0.00 0 0 0 0
Execute 1 0.00 0.00 0 0 0 0
Fetch 2 0.00 0.00 0 4 0 4
------- ------ -------- ---------- ---------- ---------- ---------- ---------- total 4 0.00 0.00 0 4 0 4
Misses in library cache during parse: 0
Optimizer goal: CHOOSE
Parsing user id: 57
Rows Row Source Operation
------- ---------------------------------------------------
4 TABLE ACCESS FULL DEPT
3)报告中各个项目的含义:
count:查询执行的次数,正常情况下,一个SQL语句parse一次,execute 一次或多于一次。
Cpu:语句执行花费的cpu时间,以1/1000秒为单位。
Elapsed:执行这条语句一共花费的时间,包括cpu时间和等待时间,如果elapsed相对cpu很大的话,说明此语句在等待某些事件,具体事件类型可以通过文件底部的内容看出。如果cpu超过elapsed,是因为计时精确度的不同所引起的误差,实际是不可能存在这种情况的。
Disk:phisical reads(gets)。
Qurey:consistent reads(gets)。
Current:current reads。
Rows:在select操作中,出现在fetch栏目,在修改操作中,出现在execute 栏目中。
4)报告中的执行计划是真正的执行结果,与autotrace的区别是,它包含每
个步骤流出的rows数量。
5)当设置set event时,在报告的最后将出现wait events:
alter session set events ‘10046 trace name context forever,level 12’