tassel

Tassel主要是研究基因型与表现型之间的关系。有多种功能,包括:关联分析、评估进化关系、主成分分析、聚类分析、推断缺失数据、数据的可视化。
安装:1、下载Java Runtime Environment并安装;
2、下载tassel_standalone.zip并解压;
3、双击解压后文件里的jar文件(sTASSEL.jar),或者打开cmd命令窗口输入命令java
-Xms256M –Xmx768M –jar sTASSEL.jar(要指定sTASSEL.jar文件路径),即可使
用。
使用:
1.data菜单栏里面的常用功能介绍:
1.1、Load(下面介绍常见的几种格式)
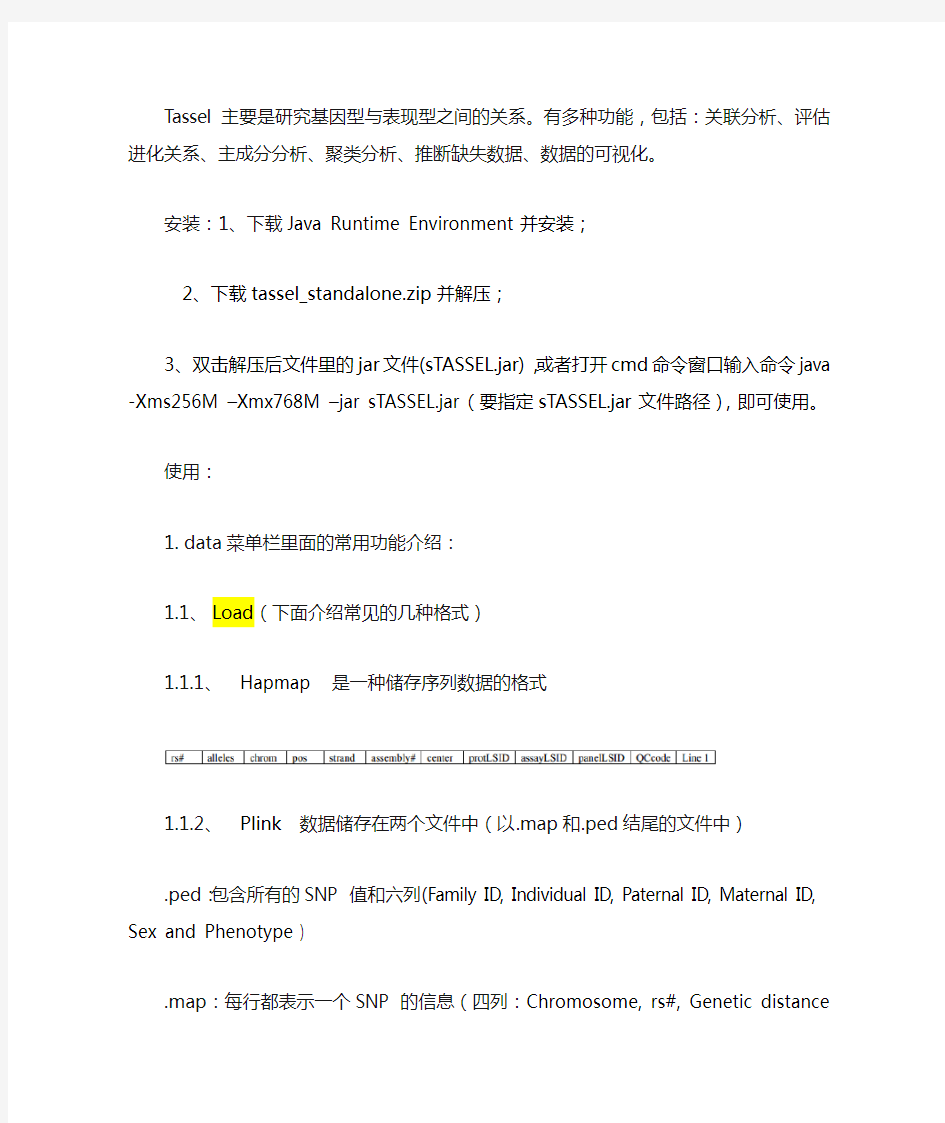
1.1.1、Hapmap 是一种储存序列数据的格式
1.1.2、Plink数据储存在两个文件中(以.map和.ped结尾的文件中)
.ped:包含所有的SNP 值和六列(Family ID, Individual ID, Paternal
ID, Maternal ID, Sex and Phenotype )
.map:每行都表示一个SNP 的信息(四列:Chromosome, rs#,
Genetic distance and Position)
1.1.3、Flapjack 数据储存在两个文件中(以.map和.geno结尾的文件中)
.geno:第一行的第一列是空的,后面的列是SNP ID,从第二行起
的第一列都为种系名字
.map:每行都表示一个SNP 的信息(三列:SNP ID,Chromosome,
Position)
1.1.4、Polymorphism
1.1.5Numerical data
协方差格式:
1.1.6、Square Numerical Matrix
1.1.7、Genetic Map
1.2、Sites
1.3、Site Names 从数据库中选择基因型数据
1.4、Taxa 从数据库中选择基因型、表型、群体结构数据
1.5、Traits
用于numerical data sets中:可以改变性状类型、遗弃不需要的性状
1.6、Transform
When a genotype data set is selected, the data are transformed to numbers. When a numerical data set is selected, mathematical transformation, data imputation and principal component analysis (PCA) can be performed. The Transform columns tags will be displayed in a Data dialog box with three tabs: Trans, Impute and PCA.
基因型转化为表型后出现的窗口:
点击转化数字性数据后出现的窗口:
1.7、Synonymize Taxa Names
1.8、Union Join 取数据的并集
1.9、Intersection Join 取数据的交集
2、Analysis Mode
2.1、Diversity
2.2、Linkage Disequilibrium 针对SNP数据的
首先要做一下过滤数据(apply Data Sites first);
然后将进行LD分析(估计出D', r2 and P-values)
2.3、Cladogram
2.4、Kinship 针对SNP数据计算的
2.5、GLM
进行这项分析时,要有经过Trait Filter处理后的三个文件(gene sequence + population structure + phenotype),将这三个文件进行Intersection (∩) Join。
运行处两个结果文件(one containing trait by marker F-tests and the other containing allele estimates).,如下:
2.6、MLM
运行的文件是运行GLM的合并文件和一个矩阵文件,将出现两个结果文件(model statistics and model effects)。但是,If compression is used, the analysis creates three tables.
展示每个性状测试的结果文件:
展示每个标记的每个等位基因的估计效果:
2.7、Ridge Regression
这项功能是通过基因型来预测表型,是基因选择的一个方法。
输入的数据集包括一个或多个表型数据和数值型标记数据,将会在“Numerical”出现两个结果文件(genomic estimated breeding values (GEBVs) for each taxon and the other will contain best linear unbiased estimates(BLUPs)for each marker in the genotype file)
3、Result Mode 结果菜单栏
3.1、Table
3.2、Tree Plot
3.4、LD Plot
3.5、Chart
Tassel几个常用功能:
1、Missing Phenotype Imputation
首先选择数据,然后点击“Transform”→”Impute”→”Create Data set”。结果如下:
2、Principal Component Analysis
步骤:1.移除单型位点:选中基因型数据,点击Site→Filter。(Set the minimum frequency to 0.05)
2.数值化:选中过滤的基因型数据,点击Transform→Create data set。(设置默认)
3.缺失值的推断:选中数值化数据,点击Transform→ Impute→Create data set。(设置默认)
4.PCA:选中推断的数值化数据,点击Transform→ PCA → Components →Create data set。
(Change the default option to “Components=3”)
5.画图:result→chart
示意图如下:
3、Estimation of Kinship using genetic markers
1.移除单型位点:选中基因型数据,点击Site→“Remove minor SNP status,”→Filter。
(Set the threshold on MAF to 0.05)
2.选中过滤后的基因型数据,点击Kinship
结果为:
4、Association analysis using GLM
1.移除单型位点:选中基因型数据,点击Site→“Remove minor SNP status,”→ Filter。
(Set the threshold on MAF to 0.05)
2.选择性状:选中表型数据,点击Trait→选择表型→ OK.
3.选择协变量:选中过滤的表型数据(population structure)→ Trait→选择群体→ OK。
4.联合数据:选中上面三个过滤数据,点击Intersection (∩) Join
5.GLM:选中联合数据,点击GLM
示意图如下:
5、Association analysis using MLM 选中GLM的联合数据+ 矩阵数据,点击MLM 示意图如下: