纤维素结晶度的权威论文
ORIGINAL PAPER
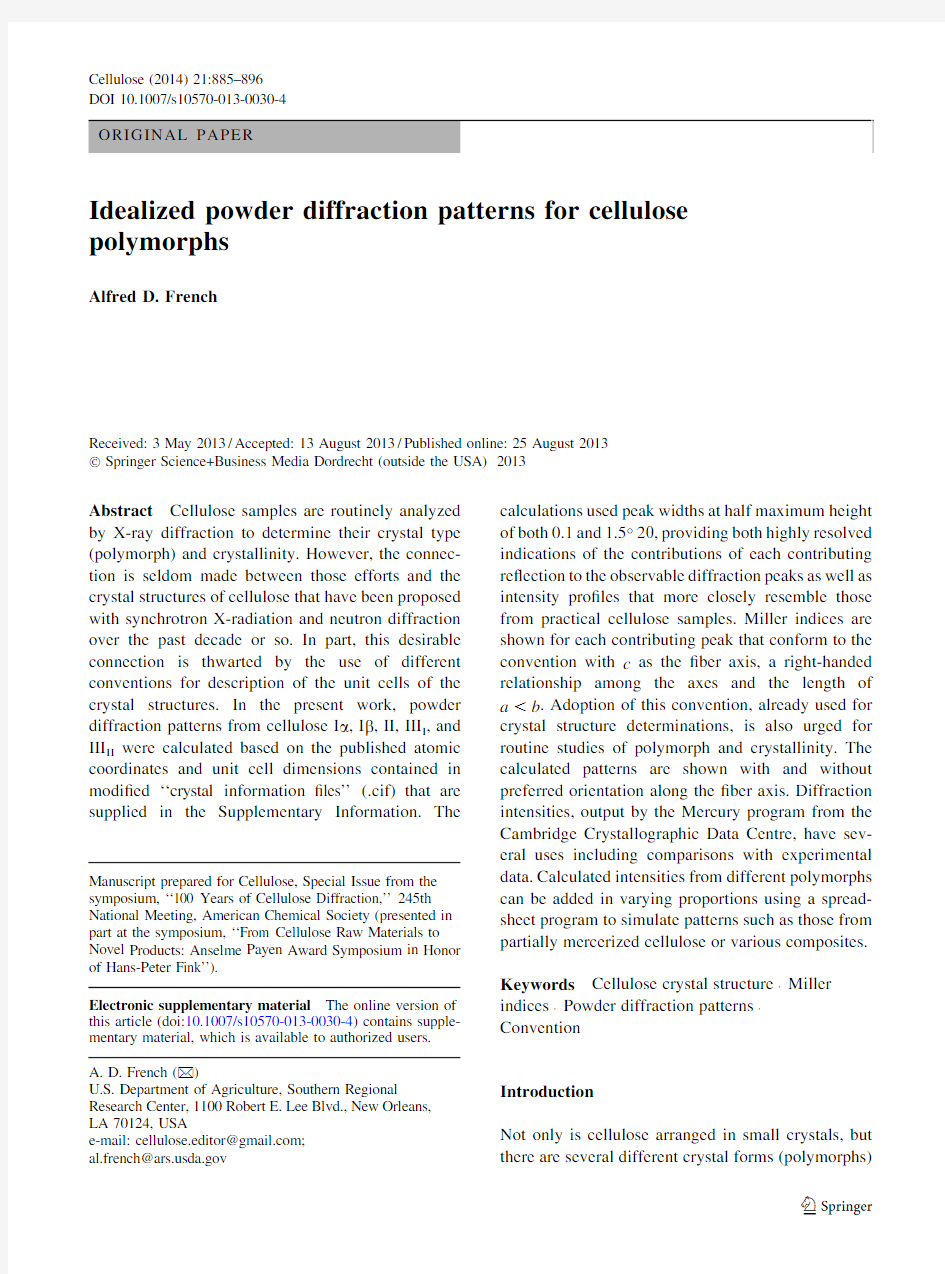
Idealized powder diffraction patterns for cellulose polymorphs
Alfred D.French
Received:3May 2013/Accepted:13August 2013/Published online:25August 2013óSpringer Science+Business Media Dordrecht (outside the USA)2013
Abstract Cellulose samples are routinely analyzed by X-ray diffraction to determine their crystal type (polymorph)and crystallinity.However,the connec-tion is seldom made between those efforts and the crystal structures of cellulose that have been proposed with synchrotron X-radiation and neutron diffraction over the past decade or so.In part,this desirable connection is thwarted by the use of different conventions for description of the unit cells of the crystal structures.In the present work,powder diffraction patterns from cellulose I a ,I b ,II,III I ,and III II were calculated based on the published atomic coordinates and unit cell dimensions contained in modi?ed ‘‘crystal information ?les’’(.cif)that are supplied in the Supplementary Information.The
calculations used peak widths at half maximum height of both 0.1and 1.5°2h ,providing both highly resolved indications of the contributions of each contributing re?ection to the observable diffraction peaks as well as intensity pro?les that more closely resemble those from practical cellulose https://www.wendangku.net/doc/a67290091.html,ler indices are shown for each contributing peak that conform to the convention with c as the ?ber axis,a right-handed relationship among the axes and the length of a \b .Adoption of this convention,already used for crystal structure determinations,is also urged for routine studies of polymorph and crystallinity.The calculated patterns are shown with and without preferred orientation along the ?ber axis.Diffraction intensities,output by the Mercury program from the Cambridge Crystallographic Data Centre,have sev-eral uses including comparisons with experimental data.Calculated intensities from different polymorphs can be added in varying proportions using a spread-sheet program to simulate patterns such as those from partially mercerized cellulose or various composites.Keywords Cellulose crystal structure áMiller indices áPowder diffraction patterns áConvention
Introduction
Not only is cellulose arranged in small crystals,but there are several different crystal forms (polymorphs)
Manuscript prepared for Cellulose,Special Issue from the symposium,‘‘100Years of Cellulose Diffraction,’’245th National Meeting,American Chemical Society (presented in part at the symposium,‘‘From Cellulose Raw Materials to Novel Products:Anselme Payen Award Symposium in Honor of Hans-Peter Fink’’).
Electronic supplementary material The online version of this article (doi:10.1007/s10570-013-0030-4)contains supple-mentary material,which is available to authorized users.A.D.French (&)
U.S.Department of Agriculture,Southern Regional
Research Center,1100Robert E.Lee Blvd.,New Orleans,LA 70124,USA
e-mail:cellulose.editor@https://www.wendangku.net/doc/a67290091.html,;al.french@https://www.wendangku.net/doc/a67290091.html,
Cellulose (2014)21:885–896DOI 10.1007/s10570-013-0030-4
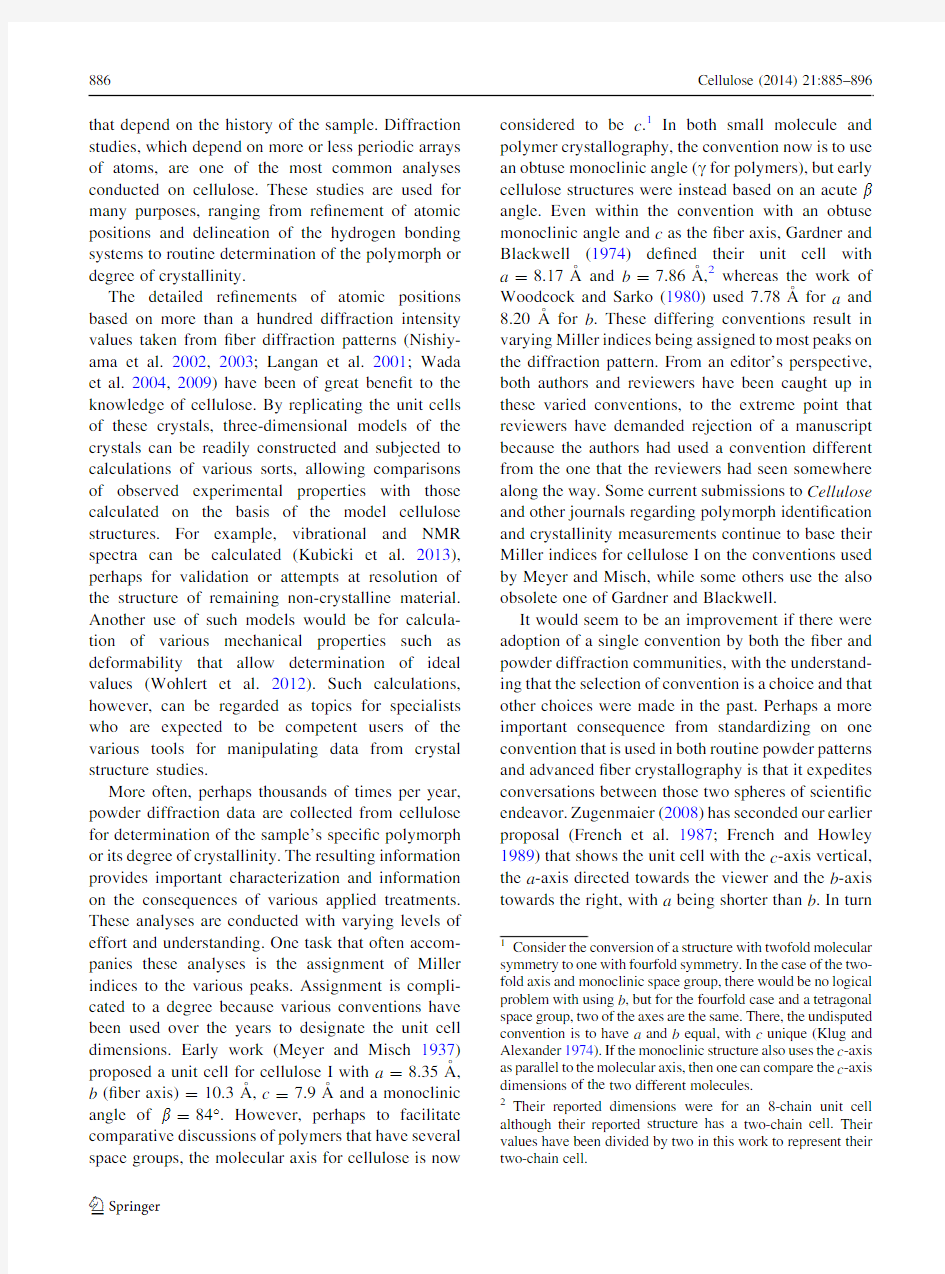
that depend on the history of the sample.Diffraction studies,which depend on more or less periodic arrays of atoms,are one of the most common analyses conducted on cellulose.These studies are used for many purposes,ranging from re?nement of atomic positions and delineation of the hydrogen bonding systems to routine determination of the polymorph or degree of crystallinity.
The detailed re?nements of atomic positions based on more than a hundred diffraction intensity values taken from?ber diffraction patterns(Nishiy-ama et al.2002,2003;Langan et al.2001;Wada et al.2004,2009)have been of great bene?t to the knowledge of cellulose.By replicating the unit cells of these crystals,three-dimensional models of the crystals can be readily constructed and subjected to calculations of various sorts,allowing comparisons of observed experimental properties with those calculated on the basis of the model cellulose structures.For example,vibrational and NMR spectra can be calculated(Kubicki et al.2013), perhaps for validation or attempts at resolution of the structure of remaining non-crystalline material. Another use of such models would be for calcula-tion of various mechanical properties such as deformability that allow determination of ideal values(Wohlert et al.2012).Such calculations, however,can be regarded as topics for specialists who are expected to be competent users of the various tools for manipulating data from crystal structure studies.
More often,perhaps thousands of times per year, powder diffraction data are collected from cellulose for determination of the sample’s speci?c polymorph or its degree of crystallinity.The resulting information provides important characterization and information on the consequences of various applied treatments. These analyses are conducted with varying levels of effort and understanding.One task that often accom-panies these analyses is the assignment of Miller indices to the various peaks.Assignment is compli-cated to a degree because various conventions have been used over the years to designate the unit cell dimensions.Early work(Meyer and Misch1937) proposed a unit cell for cellulose I with a=8.35A?, b(?ber axis)=10.3A?,c=7.9A?and a monoclinic angle of b=84°.However,perhaps to facilitate comparative discussions of polymers that have several space groups,the molecular axis for cellulose is now considered to be c.1In both small molecule and polymer crystallography,the convention now is to use an obtuse monoclinic angle(c for polymers),but early cellulose structures were instead based on an acute b angle.Even within the convention with an obtuse monoclinic angle and c as the?ber axis,Gardner and Blackwell(1974)de?ned their unit cell with a=8.17A?and b=7.86A?,2whereas the work of Woodcock and Sarko(1980)used7.78A?for a and 8.20A?for b.These differing conventions result in varying Miller indices being assigned to most peaks on the diffraction pattern.From an editor’s perspective, both authors and reviewers have been caught up in these varied conventions,to the extreme point that reviewers have demanded rejection of a manuscript because the authors had used a convention different from the one that the reviewers had seen somewhere along the way.Some current submissions to Cellulose and other journals regarding polymorph identi?cation and crystallinity measurements continue to base their Miller indices for cellulose I on the conventions used by Meyer and Misch,while some others use the also obsolete one of Gardner and Blackwell.
It would seem to be an improvement if there were adoption of a single convention by both the?ber and powder diffraction communities,with the understand-ing that the selection of convention is a choice and that other choices were made in the past.Perhaps a more important consequence from standardizing on one convention that is used in both routine powder patterns and advanced?ber crystallography is that it expedites conversations between those two spheres of scienti?c endeavor.Zugenmaier(2008)has seconded our earlier proposal(French et al.1987;French and Howley 1989)that shows the unit cell with the c-axis vertical, the a-axis directed towards the viewer and the b-axis towards the right,with a being shorter than b.In turn 1Consider the conversion of a structure with twofold molecular symmetry to one with fourfold symmetry.In the case of the two-fold axis and monoclinic space group,there would be no logical problem with using b,but for the fourfold case and a tetragonal space group,two of the axes are the same.There,the undisputed convention is to have a and b equal,with c unique(Klug and Alexander1974).If the monoclinic structure also uses the c-axis as parallel to the molecular axis,then one can compare the c-axis dimensions of the two different molecules.
2Their reported dimensions were for an8-chain unit cell although their reported structure has a two-chain cell.Their values have been divided by two in this work to represent their two-chain cell.
that was grounded in statements by Klug and Alex-ander(1974)and used by Woodcock and Sarko (1980).
In the past few years,we(Nishiyama et al.2012) have taken advantage of the availability of the x,y,and z atomic coordinates from the crystal structures to calculate both powder and?ber diffraction patterns for cellulose.These calculations were based on different sizes of crystals,either from the coordinates of one asymmetric unit in the unit cell,using the Mercury program(Macrae et al.2008)or from crystal models that had various shapes,sizes and amounts of water or deviation from a perfect lattice that resulted from molecular dynamics studies.The latter calculations were carried out with either the Debyer software for powder patterns(Wojdyr2011),or custom software by Dr.Nishiyama for?ber patterns(Nishiyama et al. 2012).These efforts are beginning to provide an atomistic visualization of cellulosic materials.
The present work is based only on the Mercury3.0 program,which is available in both free download and full-capability versions(Macrae et al.2008).This program requires the unit cell dimensions and the fractional atomic coordinates of the asymmetric unit to instantly produce a powder pattern.The primary goal here is simple,namely to present the calculated diffraction patterns from the different polymorphs with the recommended indexing.With an input peak width at half maximum height(pwhm)of1.5°2h,a pattern can be calculated that resembles an experimental pattern from a fairly crystalline sample of practical interest.By also using the Mercury’s default pwhm value of0.1°2h,a pattern is calculated that is much sharper than will be attained with any cellulose sample, but it resolves the peaks to show them mostly without overlap.Powder diffraction patterns are sometimes subjected to deconvolution during analysis,with arbi-trary choices of the contributing peaks.A secondary goal of the present work is to show,based on the calculated patterns having narrow peak widths,which peaks should be considered during deconvolution.
Another facility of the Mercury program(paid licenses only)is to account for preferred orientation of the sample.Because of the aspect ratio of cellulose ?ber fragments that are used as samples for powder diffraction,it is dif?cult to avoid some degree of preferred orientation.Therefore,patterns were calcu-lated both with and without preferred orientation along the c-axis.Not only is preferred orientation dif?cult to avoid in experiments on cellulose,but it was originally recommended when calculating the Segal crystallinity index analysis(Segal et al.1959;French and Santiago Cintro′n2013).In the latter paper,the pattern from the oriented cellulose I b sample was indicated to have a slightly higher Segal Crystallinity Index than for the random pattern.None of the information herein is particularly novel or unique,but the idea here is to present a practical visual indication of the Miller indices of the often overlapped peaks and their approximate proportions.
Input information
Crystal information?les(.cif)for cellulose I a and I b were obtained from the Supplementary Information accompanying the original reports(Nishiyama et al. 2002,2003).Those?les contain both X-ray and neutron structures.(These structures are also found in the Cambridge Crystallographic Database with Ref-codes PADTUL and PADTUL01(cellulose I a)and JINROO01and JINROO02(cellulose I b).)The X-ray coordinates have no hydroxyl hydrogen atoms present and the neutron diffraction coordinates have deute-rium atoms in the positions of the hydroxyl hydrogen atoms.The Supplementary Information includes mod-i?ed.cif?les for cellulose I a and I b that eliminate the coordinates from the X-ray study and other informa-tion not needed for the calculation of powder patterns. The deuterium atoms of the neutron studies are renamed as hydrogen atoms.That was done to avoid any effect on the pattern from the presence of deuterium.Because the original.cif for I a was reported with a as the?ber axis(the main original article reported c as the?ber axis),the revised.cif?le in Supplementary Information has coordinates that were transformed so that c is the?ber axis.If the.cif?le were to be used for constructing models to be studied with energy calculations,only the A or B scheme hydrogen atoms should be used.For calculations of the X-ray pattern,the A and B atoms should be used. Small differences can be observed in the calculated patterns when they are not included.
A.cif?le for the cellulose II structure(Langan et al. 2001)was kindly sent by https://www.wendangku.net/doc/a67290091.html,ngan and a shortened version is supplied in Supplementary Information.The .cif?les for cellulose III I and III II were created manually from the published coordinates(Wada et al.
2004,2009,respectively)and the minimum of infor-mation needed for a functional.cif.Those?les are also provided as Supplementary Information.
The default calculated powder patterns were cus-tomized with a CuK a wavelength of 1.5418A?, typically used in powder diffractometers.Pwhm values of0.1and1.5°2h were used.The intensity vs.2h data were saved and re-plotted with plotting software to make combined plots.The cropped bitmap image of the expected peak positions from the Mercury powder plots was copied and pasted onto the plots in a drawing https://www.wendangku.net/doc/a67290091.html,ler indices were obtained from a list of re?ections produced by Mercury and manually added to the expected peak positions.Preferred orientation was also part of the customization process in Mercury,with a March-Dollase factor of1.8(Dollase1986)applied to the(001)plane for the monoclinic structures.In the case of triclinic I a,speci?cation of the(001)plane resulted in increases in many of the intensities relative to the main(110)peak.Earlier versions of this paper attempted to explain this behavior that was opposite to the results for the monoclinic structures.Ultimately it was realized that the problem was that the(001)plane was not normal to the molecular axis for the triclinic structure,unlike the situation for the monoclinic structures.Specifying the(001)plane in the Mercury customization data window did not therefore result in preferred orientation of the?ber axes as intended. Instead,the plane to specify was(11–4),which has an interplanar spacing of2.596A?,very close to c/4.Thus, the only preferred orientation modeled was for?brous samples where the?ber axes were in a plane parallel to the sample surface,and the crystallites were randomly oriented about the?ber axes.Samples of bacterial cellulose,for example,can have additional orientation about the?ber axis,causing the(100)peak to be nearly absent from I a patterns.
Results and discussion
Figure1a,b show the calculated patterns from cellu-lose I a,based on the modi?ed.cif?le in the Supplementary Information.Unit cell dimensions were:a=6.717A?,b=5.962A?,c=10.400A?, a=118.08°,b=114.80°,and c=80.37°(Nishiy-ama et al.2003).The modi?cations involved inter-change of the unit cell dimensions to match a convention with the c-axis parallel to the molecular axis.Although the unit cell dimensions listed in their published report(Nishiyama et al.2003)are the same as used herein,their structure determination was carried out with the a-axis parallel to the molecular axis,and the coordinates in their supplementary.cif ?le are based on that convention.The three main peaks for the I a one-chain triclinic unit cell have Miller indices of(100),(010)and(110)(which are the counterparts to the(1–10)(110)and(200)peaks of the cellulose I b pattern).
The simulated patterns from the randomly oriented and preferred orientation samples are noticeably dif-ferent,but after simulating the orientation of the(11–4) plane(see last paragraph of Input information,above) set the pattern for the effects of preferred orientation for the other samples.The intensities of the non-equatorial re?ections,mostly weak in the random pattern,nearly disappear.Note also that the weak(001),(002),and (003)peaks on the I a pattern at10.48°,21.05°,and 31.8°2h,have d-spacings of8.44,4.22,and2.81A?, respectively.They do not correspond to divisions of the 10.40A?c-axis dimension by1,2,and3,as would be the case for a monoclinic structure.The(004)re?ection is beyond the40°2h cut-off.Finally,the present unit cell admittedly does not conform to conventions that call for all triclinic cell angles to be greater than90°. Here,priority was given to having the c-axis match the molecular dimension.
Figure2a shows the calculated diffraction patterns for randomly oriented powder samples of cellulose I b, and Fig.2b presents the patterns for I b samples with preferred orientation along the c-axis.Unit cell dimensions were:a=7.784A?,b=8.201A?, c=10.380A?,and c=96.55°(Nishiyama et al. 2002).As previously stated(French and Santiago Cintro′n,2013),both simulated diffraction curves correspond to perfect crystals.The difference in the simulated intensity pro?les is strictly the result of different crystallite sizes,and the‘‘background’’level around18°2h for the curves with1.5°2h pwhm results from overlap of the diffraction peaks.On these simulated patterns,there is no modeling of amorphous scattering.Therefore,in various calculations of cellu-lose crystallinity,it is generally not appropriate to position a background intensity curve(attributed to amorphous scattering)as high as the minimum intensity at18°2h.The shoulder at about20.5°2h for the(012)and(102)re?ections on the random pattern is not obvious on the pattern with preferred
orientation.The positions of the absent,odd-order [(001)and (003)]meridional re?ections are indicated by green lines above their green Miller indices instead of the purple lines for the other re?ections.The main contributors of intensity to the three main peaks have Miller indices of (1–10),(110)and (200).
The
Fig.1a Simulated cellulose I a powder pattern for randomly oriented crystallites with 0.1°and 1.5°peak widths at half maximum intensity.Magenta lines indicate the positions of the calculated peaks,and the black vertical lines on the scale correspond to the 5°intervals.The image was prepared with the aid of the Mercury program (see text)which output ?les with the intensities and the Miller indices;the magenta lines were taken from the saved image of the powder pattern from the Mercury program.b Cellulose Ia with crystallites having preferred orientation along the ?ber axis
moderate peak on the random 1.5°pwhm curve near 34.5°is seen to be a composite of several re?ections and (004)is not the dominant contributor.
These Miller indices [(1–10)and (110)]for the peaks at 14.88°and 16.68°2h are the same as those used by Gardner and Blackwell (1974)despite their
assignment of the a -axis to the 8.20A
?repeat and the b -axis to the 7.88A
?dimension.However,their assignments do interchange the indexing for the major peak,with Miller indices of (020)instead of the
(200)
Fig.2a Cellulose I b with random (a )orientation of the crystallites.b Cellulose I b with preferred orientation of the crystallites along the ?ber axis
values promoted herein.Because of this difference,it was not immediately obvious that the chain packing in their unit cell was different from that in the monoclinic (MM subcell)unit cell from Syracuse(Sarko and Muggli1974).The packing in the Gardner and Blackwell cell corresponds to a‘‘down’’instead of ‘‘up’’orientation of the molecules(French and Howley 1989)for the unit cell used herein,whereas the packing is parallel up in Sarko and Muggli’s structure and in the Nishiyama et al.(2002)structure.
Figure3a,b show the patterns for cellulose II samples with random and preferred orientation.Unit cell dimensions were:a=8.10A?,b=9.03A?, c=10.31A?,and c=117.10°(Langan et al.,2001). Both the0.1°and1.5°patterns from the sample with preferred orientation are considerably simpli?ed, compared to the random model,by the near absence of re?ection intensities from upper layer lines.The three main peaks have Miller indices of(1–10),(110) and(020).The peak for the latter re?ection,at about 22.1°2h,has contributions from two adjacent re?ec-tions.To ascertain which re?ection is responsible for the majority of the intensity it was helpful to plot the diffraction pattern for only a small range,say from19 to23°2h,along with a step size of0.01°2h.The window with the calculated diffraction patterns in the Mercury program can be stretched to the full width of the monitor as well.Note that this re?ection(020)is often mistakenly labeled as(200)—e.g.Yue et al. (2012).The.hkl?le that is output from Mercury also lists the intensities of the various re?ections.For example,it gives the calculated intensity for the (1–10)re?ection as2480.7,and a value of1.1for the (100)peak,easily resolving that(1–10)is the dom-inant contributor to the peak at about12.2°2h.
The simulated patterns for cellulose III I are shown in Fig.4,based on unit cell dimensions of a=4.45A?, b=7.85A?,c=10.33A?,and c=105.1°(Wada et al. 2004).Because the cellulose III I structure has only a one-chain unit cell with twofold screw-axis symmetry, the number of re?ections is limited,with only ten peaks possible before25°2h(cellulose II has19and I a has 14).The difference between the patterns for random (Fig.4a)and oriented samples(4b)is dramatic because of the strong presence of the(002)re?ection on the random pattern,and its near absence on the pattern from the sample with preferred orientation.Because the peak at about21°2h comprises the(100),(012)and(1–10) re?ections with very strong contributions from(100)and(1–10),it is not well-suited for line pro?le analyses for crystallite size determinations.
Figure5shows the results from the study of cellulose III II by Wada et al.(2009).This one-chain unit cell with a=4.45A?,b=7.64A?,c=10.36A?, and c=106.96°has fractional occupancy,with either an‘‘up’’or‘‘down’’chain in any given unit cell.The calculated patterns show very low intensity except for the peak at12.1°2h and the composite of(1–10)and (100)peaks at20.863°and20.869°2h,respectively.
These results underscore the need to report the details of the sample preparation that would affect the orientation,such as whether the sample was a pressed pellet,or sprinkled onto sticky tape.Also,the presen-tation of the sample to the incident beam(transmission or re?ection)should be stated as that can also affect the relative intensities of the various peaks.
The intensities and spacings on these calculated patterns will not totally agree with experimentally observed patterns for several reasons.The peak posi-tions will not agree exactly,possibly because of crystallite size variations resulting in different long-range compressive forces on the crystals and unit cells (Nishiyama et al.2012).Knowing that the crystallo-graphic discrepancy index(the R factor)values are about20%in the original crystallographic studies,the observed and calculated intensities are expected to differ.(A better indicator of expected differences in this case would be the discrepancy index wR2based on the structure factors squared and weighted,values of which are about45%.)This expected deviation is why the title‘‘idealized powder diffraction patterns’’was cho-sen.The patterns calculated by Mercury are isotropic; there is no way to input crystallite shape information. That can affect the relative peak heights and widths.If the crystal structures are re-determined in the future,the appropriate?gures herein should be replaced.
From the experimental side,it is almost impossible to obtain powder pattern samples with completely random orientation or complete orientation in a given direction.That could be compensated for by calculat-ing patterns with varying values of the March-Dollase orientation parameter(Dollase1986).Another factor is the sample itself.It may not be pure,it may have minor amounts of another polymorph,and,especially when sample sizes are marginal,signals from the sample presentation system,such as adhesive tape may also occur.The latter problem should be easily corrected once identi?ed.Some diffuse scattering
from non-crystalline material is also going to be present that is not taken into account by these calculations.
Of course,many samples of interest are likely to contain more than one crystal form,such as partially mercerized samples that would be mixtures of cellu-lose I and II.It is important to not try to interpret such patterns with an assumption that only one form is present.However,given the ability to calculate intensity versus 2h data for the various
polymorphs
Fig.3a Simulated powder diffraction patterns for cellulose II crystallites having random orientation.b Simulated powder diffraction pattern for cellulose II with preferred orientation of the crystallites along the ?ber axis
with a range of peak width values,it is simple to add together the intensity data (perhaps with a spreadsheet program)to obtain theoretical patterns for mixtures of either cellulose of different polymorphs or cellulose with other polysaccharides such as xylan (Nieduszyn-ski and Marchessault 1972)in
composites.
Fig.4a Simulated powder diffraction pattern for cellulose III I with random orientation of the crystallites.b Simulated powder pattern for cellulose III I with preferred orientation for the crystallites along the ?ber axis
Conclusions
Ideal diffraction patterns were readily calculated with the Mercury program using as input the crystal information ?les (.cif)that are provided in the Supplementary Information.The patterns were pre-sented for both very narrow,well-resolved peaks and for the broader peaks that are found for the most crystalline practical higher plant cellulose such as cotton.This graphical representation shows
which
Fig.5a Simulated powder diffraction pattern for cellulose III II with random orientation of the crystallites.b Simulated diffraction pattern for cellulose III II with preferred orientation of the crystallites about the ?ber axis
re?ections are contributing to a given peak.Indexing for these peaks conforms to the modern nomenclature, with c as the?ber axis,an obtuse monoclinic angle, and the a-axis shorter than the b-axis.The Mercury program and the.cif?les in Supplementary Informa-tion make it easy for even the novice to create calculated patterns for various purposes.For example, the calculated intensity versus2h data from various structures can be added in varying proportions to simulate diffraction patterns from partially mercerized samples or composite materials.
Supplementary information
Crystal information?les(.cif)are provided for the?ve cellulose polymorphs described in this work.These ?les were either modi?cations of published or unpub-lished.cif?les or created from the published unit cell parameters and coordinates by putting them into the .cif format.Readers are advised to copy the entire contents,starting with the line‘‘#Modi?ed Crystal Information File for I a cellulose’’into a text editor such as Microsoft Notepad and saving the?le as e.g.,‘‘all_cellulose.cif’’.The Mercury program will then allow any of the structures to be selected. Acknowledgments Paul Langan kindly provided the.cif?le for cellulose II.The research was partly inspired by collaborative efforts with Cotton,Incorporated.Drs.Santiago Cintro′n,Seong Kim and Xueming Zhang kindly commented on preliminary versions of the manuscript.Dr.Edwin Stevens consulted on the effects of preferred orientation on the cellulose I a pattern.
References
Dollase WA(1986)Correction of intensities for preferred ori-entation in powder diffractometry:application of the March model.J Appl Crystallogr19(4):267–272.doi:10.
1107/S0021889886089458
French AD,Howley PS(1989)Comparisons of structures pro-posed for cellulose.In:Scheurch C(ed)Cellulose and wood—chemistry and technology.Wiley,New York, pp159–167
French AD,Santiago Cintro′n M(2013)Cellulose polymorphy, crystallite size,and the segal crystallinity index.Cellulose 20:583–588.doi:10.1007/s10570-012-9833-y
French AD,Roughead WA,Miller DP(1987)X-ray diffraction studies of ramie cellulose I.In:Atalla RH(ed)The struc-tures of cellulose—characterization of the solid states.
ACS Symp Ser340,pp15–17Gardner KH,Blackwell J(1974)The structure of native cellu-lose.Biopolymers13:1975–2001.doi:10.1002/bip.1974.
360131005
Klug HP,Alexander LE(1974)X-ray diffraction procedures for polycrystalline and amorphous materials,2nd edn.Wiley, New York,p13
Kubicki JD,Mohamed MN-A,Watts HD(2013)Quantum mechanical modeling of the structures,energetics and spectral properties of I a and I b cellulose.Cellulose 20:9–23.doi:10.1007/s10570-012-9838-6
Langan P,Nishiyama Y,Chanzy H(2001)X-ray structure of mercerized cellulose II at1A?resolution.Biomacromole-cules2:410–416.doi:10.1021/bm005612q
Macrae CF,Gruno IJ,Chisholm JA,Edgington PR,McCabe P, Pidcock E,Rodriguez-Monge L,Taylor R,van de Streek J, Wood PA(2008)Mercury CSD2.0-new features for the visualization and investigation of crystal structures.J Appl Crystallogr41:466–470.doi:10.1107/S0021889807067908 Meyer KH,Misch L(1937)Positions des atomes dans le nou-veau mode′le′spatial de la cellulose.Helv Chim Acta 20:232–244.doi:10.1002/hlca.19370200134 Nieduszynski IA,Marchessault RH(1972)Structure of b, d(1?4)-xylan hydrate.Biopolymers11:1335–1344.
doi:10.1002/bip.1972.360110703
Nishiyama Y,Langan P,Chanzy H(2002)Crystal structure and hydrogen-bonding system in cellulose I b from synchrotron X-ray and neutron?ber diffraction.J Am Chem Soc 124(31):9074–9082.doi:10.1021/ja0257319 Nishiyama Y,Sugiyama J,Chanzy H,Langan P(2003)Crystal structure and hydrogen bonding system in cellulose I a, from synchrotron X-ray and neutron?ber diffraction.J Am Chem Soc125:14300–14306.doi:10.1021/ja037055w Nishiyama Y,Johnson GP,French AD(2012)Diffraction from nonperiodic models of cellulose crystals.Cellulose 19:319–336.doi:10.1007/s10570-012-9652-1
Sarko A,Muggli R(1974)Packing analysis of carbohydrates and polysaccharides III.Valonia cellulose and cellulose II.
Macromolecules7:486–494
Segal L,Creely JJ,Martin AE,Conrad CM(1959)An empirical method for estimating the degree of crystallinity of native cellulose using the X-ray diffractometer.Text Res J 29(10):786–794.doi:10.1177/004051755902901003 Wada M,Chanzy H,Nishiyama Y,Langan P(2004)Cellulose III I crystal structure and hydrogen bonding by synchrotron X-ray and neutron?ber diffraction.Macromolecules 37:8548–8555.doi:10.1021/ma0485585
Wada M,Heux L,Nishiyama Y,Langan P(2009)X-ray crys-tallographic,scanning microprobe X-ray diffraction,and cross-polarized/magic angle spinning13C NMR studies of the structure of cellulose III II.Biomacromolecules 10:302–309.doi:10.1021/bm8010227
Wohlert J,Bergenstra?hle-Wohlert M,Berglund LA(2012) Deformation of cellulose nanocrystals:entropy,internal energy and temperature dependence.Cellulose19:1821–1836.doi:10.1007/s10570-012-9774-5
Wojdyr M(2011)http://www.unipress.waw.pl/debyer and https://www.wendangku.net/doc/a67290091.html,/p/debyer/wiki/debyer Woodcock C,Sarko A(1980)Packing analysis of carbohydrates and polysaccharides11.Molecular and crystal structure of native ramie cellulose.Macromolecules13:1183–1187.
doi:10.1021/ma60077a030
Yue Y,Zhou C,French AD,Xia G,Han G,Wang Q,Wu Q (2012)Comparative properties of cellulose nano-crystals from native and mercerized cotton?bers.Cellulose 19:1173–1187.doi:10.1007/s10570-012-9714-4Zugenmaier P(2008)Crystalline cellulose and cellulose deriv-atives.Characterization and structure.Springer,Berlin, p72
专长介绍–纤维素纳米晶体CNC的应用研究和开发
专长介绍 – 纤维素纳 米晶体 (CNC) 的应用研究和开发 艾伯塔省科技创新研究院 (AITF) 运营的纤维素纳米晶体 (CNC) 中试工厂是世界上仅有的几家能大批量生产的设施之一, 可日产几公斤高品质的 CNC 材料。 这一充满活力,有高度灵活性的中试装置具备创造和评估改性 CNC 材料的能力与专长。 创建这一耗资五百五十万加元的中试装置是加拿大和艾伯塔省两级政府与工业界 (艾伯塔太平洋森林工业公司 AlPac) 伙伴关系的合作结果,可以从多种高α- 纤维素含量的纤维原料生产CNC 。自2013 年初以来,该工厂已用硫酸盐木浆纤维(包括针,阔叶木)和溶解浆生产高品质 CNC ,用来进行各种不同应用的测试,其最终目的是为商业化生产做准备。AITF 也有能力用秸秆纤维(例如,亚麻和大麻)生产高品质的 CNC 。无论用何种原料,中试工厂都能够生产出各种形态的 CNC 成品,包括喷雾干燥粉末或各种浓度的悬浮液。 CNC 具有许多有用的特性,包括高强度,光学性能和非常大的表面积。通过中试工厂及它的玻璃衬里反应器,研究人员可以针对一系列广泛用途,动态地评估并验证从各种生物质原料得到的 CNC ,各种应用包括钻井液,采矿尾渣处理,油漆和工业涂料,汽车部件,建材,塑料和包装。 架起发现和商业之间的桥梁 提供的研发项目和服务为艾伯塔在能源与环境, 生物产业和健康等优先领域建立起具有全球竞争力的商业。 AITF 的团队提供了一套从基础科学到更技术性专长的全面技能。我们团队在木材化学,分析表证,和应用开发方面具备相当多的专业知识,并有着中试工厂运作的卓越技能。总之,这一技能,知识和经验的集合,既能确保精确与可控的项目设计,同时又能灵活和及时地交付项目。作为艾伯塔省 CNC 专业大集群的一个活跃成 员,AITF 和 CNC 中试工厂现已定位好并愿意邀请世界各地工业和科研界的潜在伙伴一起合作,为这一充满希望的新材料共同开发新的用途和市场。我们期待着与您讨论关于我们提供 CNC 样品和寻求合作伙伴关系的可能性。 创新动力来自于
纳米纤维素晶体及复合材料的研究进展_王铈汶
2013年第58卷第24期:2385~2392 https://www.wendangku.net/doc/a67290091.html, https://www.wendangku.net/doc/a67290091.html, 引用格式: 王铈汶, 陈雯雯, 孙佳姝, 等. 纳米纤维素晶体及复合材料的研究进展. 科学通报, 2013, 58: 2385–2392 Wang S W, Chen W W, Sun J S, et al. Recent research progress of nanocellulose crystal and its composites with polymers (in Chinese). Chin Sci Bull (Chin Ver), 2013, 58: 2385–2392, doi: 10.1360/972012-1684 《中国科学》杂志社 SCIENCE CHINA PRESS 进展 纳米纤维素晶体及复合材料的研究进展 王铈汶①②, 陈雯雯②, 孙佳姝②, 黎国康③, 李孝红①*, 蒋兴宇②* ①西南交通大学材料科学与工程学院, 先进材料技术教育部重点实验室, 成都 610031; ②国家纳米科学中心, 中国科学院纳米生物安全性与生物效应重点实验室, 北京 100190; ③中国科学院广州化学研究所, 广州 510650 *联系人, E-mail: xhli@https://www.wendangku.net/doc/a67290091.html,; xingyujiang@https://www.wendangku.net/doc/a67290091.html, 2013-01-14收稿, 2013-05-06接受, 2013-07-08网络版发表 国家自然科学基金(21025520)和北京市自然科学基金(2122058)资助 摘要综述了纳米纤维素晶体(NCC)与高分子复合材料近些年发展的制备方法与潜在应用, 重点介绍了NCC与非极性高分子材料复合物在制备过程中相容性问题的解决办法及复合材 料的成型方法, 并指出无需任何表面修饰和溶剂分散、直接使用工业化的加工方法制备NCC/ 高分子复合物, 才能真正为NCC复合材料打开通往生活应用的大门. 关键词 纳米纤维素晶体 复合材料 表面修饰 相容性 生物质类材料是可再生、可生物降解且储量丰富 的绿色材料. 随着能源问题的日益严峻, 生物质类材 料越来越受到工业和科研人员的关注. 天然纤维素 是生物质的一个大类. 在我国, 最早的天然纤维素类 材料(木材和麻)的加工历史可以追溯到旧石器时代 以前. 然而, 这种宏观的纤维素类材料早已不能满足 现代人类社会对材料性能的要求. 从20世纪80年代 开始, 人们已经开始研究并掌握木材等天然纤维素 在纳米尺度的增强单元——纤维素纳米晶体(NCC)的 提取方法. 作为天然纤维素最基本的增强单元, NCC 通常呈棒状, 具有比凯芙拉纤维高的杨氏模量和比 一般陶瓷低的热膨胀系数. 因此, 近些年来利用天然 纤维素中提取的NCC制造高性能的复合材料引起了 科研人员的极大兴趣. 本文将聚焦近十年来以NCC 为第二相、高分子材料为基体的复合材料的研究进展, 重点综述复合物的界面相容性的制备及改善方法. 1 纤维素纳米晶体的制备 NCC广泛存在于植物(见图1所示)、动物和微生 物天然合成的纤维素中. 由于非晶体区域纤维素分 子排列松散, 从天然纤维素中提取、制备NCC的原 理是在酸、酶、氧化剂等的作用下, 非晶体区域优先 于晶体区域发生反应, 生成小分子而被去除, 留下纳 米尺度的纤维素晶体. 从20世纪80年代到现在, NCC的制备已经发展 出了酸解、酶解和氧化三大类方法, 其中硫酸水解是 最主流的制备方法. 值得注意的是, 不同的制备方法 得到NCC的表面性质不尽相同, 且对NCC的表面修 饰和后续应用影响较大. 如图2所示, 用浓硫酸水解 法制备NCC, 会在NCC表面留下磺酸酯基团[2], 而 盐酸水解制备的NCC表面有更多羟基. 磺酸酯基团 电离后使NCC表面带负电, 不仅有利于NCC在水溶 液中的稳定分散, 而且可以利用其表面带负电的性 质进行后续的层层自组装(LBL)、阳离子表面活性剂 或金属阳离子沉积等表面修饰. 在Fischer-Speier酯 化法中, 常使用醋酸作为水解试剂和催化剂, NCC表 面会修饰上乙酰基[3]. 随着NCC表面乙酰化程度提 高, NCC疏水性增强, 当乙酰化程度足够高时, NCC 可以很好地分散在乙酸乙酯和甲苯中, 通过这种方 法获得的NCC将能够与疏水性高分子基体有更好的 相容性. 过硫酸铵氧化法制备NCC是新近发展的一 种方法, 其优势在于用于制备NCC的原料不要求一
微晶纤维素USP
Microcrystalline Cellulose Cellulose [9004-34-6]. DEFINITION Microcrystalline Cellulose is purified, partially depolymerized cellulose prepared by treating alpha cellulose, obtained as a pulp from fibrous plant material, with mineral acids. IDENTIFICATION ? A. Procedure Iodinated zinc chloride solution: Dissolve 20 g of zinc chloride and 6.5 g of potassium iodide in 10.5 mL of water. Add 0.5 g of iodine, and shake for 15 min. Sample: 10 mg Analysis: Place the Sample on a watch glass, and disperse in 2 mL of Iodinated zinc chloride solution. Acceptance criteria: The substance takes on a violet-blue color. 氯化锌碘试液:取氯化锌20g、碘化钾6.5g,加水10.5ml。再加碘0.5g,振摇15min。 测定:取本品10mg,置表面皿上,加氯化锌碘试液2ml。 标准规定:应变为蓝紫色。 Change to read: ? B. Procedure Sample: 1.3 g of Microcrystalline Cellulose, accurately weighed to 0.1 mg Analysis: Transfer the Sample to a 125-mL conical flask. Add 25.0 mL of water and 25.0 mL of 1.0 M cupriethylenediamine hydroxide solution. Immediately purge the solution with nitrogen, insert the stopper, and shake on a wrist-action shaker, or other suitable mechanical shaker, until completely dissolved. Transfer an appropriate volume of the Sample solution to a calibrated number 150 Cannon-Fenske, or equivalent, viscometer. Allow the solution to equilibrate at 25 ±0.1 for NLT 5 min. Time the flow between the two marks on the viscometer, and record the flow time, t1, in s. 取本品1.3g,精密称定,置125mL具塞锥形瓶中,精密加入水25ml,再精密加入1mol/L 双氢氧化乙二胺铜溶液25ml,立即通入氮气以排除瓶中空气,密塞,强力振摇,使微晶纤维素溶解;取适量,置25±0.1℃水浴中,约5min后,移至刻度为150的坎农-芬斯克毛细管粘度计或同等的黏度计内(毛细管内径为0.7 ~1.0mm,选用适宜粘度计常数K1 ),照黏度测定法,于25±0.1℃水浴中测定。记录供试品溶液流经黏度计上下两刻度时的时间t1,按下式计算供试品溶液的运动黏度。 Calculate the kinematic viscosity, (KV)1, of the Microcrystalline Cellulose taken: 微晶纤维素的运动黏度(KV)1按下式计算: Result = t1 × k1 t1 = flow time (s) k1 = viscometer constant (see Viscosity—Capillary Methods 911 (CN 1-May-2015) ) Obtain the flow time, t2, for 0.5 M cupriethylenediamine hydroxide solutions using a number 100 Cannon-Fenske, or equivalent, viscometer.
纤维素纳米纤维
纤维素纳米纤维 众所周知,植物的基本组成单位是细胞,其主要结构为纤维素纳米纤维,纤维素纳米纤维是拉伸纤维素链的半结晶纤维束。纤维素纳米纤维不仅纤细,而且纤维素分子链可以拉伸和结晶,所以其质量仅为钢铁的1/5,强度却是钢铁的5倍以上。另外,其线性热膨胀系数极小,是玻璃的1/50,而且其弹性模量在-200~200℃范围内基本保持不变。弹性模量约140GPa,强度2~3GPa。不同于石油基材料,作为生物基材料,更环保。 图1 纳米纤维素微观结构作为下一代工业材料或绿色纳米材料,目前已在全世界积极地开展有关制造和利用这种纤维素纳米纤维的研究。用木材浆粕等植物类纤维材料制造纤维素纳米纤维的各种方法相继被开发出来。在低浓度(约百分之几)下进行的浆粕纤维分解技术有高压高速搅拌方法、微射流法、水中逆流碰撞法、研磨机研磨法、冷冻粉碎法、超声波分丝法、高速搅拌法和空心颗粒粉碎法等。纤维素纳米纤维重要的特征是可以用所有的植物资源作为原料。除木材外,还可以从稻杆和麦杆等农业废弃物、废纸、甘蔗和马铃薯的榨渣,以及烧酒气体等的工业废弃物中制得直径为10~50nm的纳米纤维。如果有效利用轻薄且宽域分布的生物资源的特点,则可以制造和利用取自唾手可得资源的高性能纳
米纤维。日本等发达国家已经实现了纤维素纳米纤维的工业化生产。轻量、强度高的纤维素纳米纤维作为复合材料,可制造汽车零部件和家电产品外壳、建筑材料等;利用气体阻隔性可制造屏障薄膜;利用其透明性可制作显示器和彩色滤光器、有机EL基板、太阳能电池板等;利用耐热性可制造半导体封装材料和柔性基板、绝缘材料等;利用黏弹性能,可生产化妆品、药品、食品、伤口敷料如细胞培养基材、分离器和过滤器以及特殊功能纸张等。在石油工程领域,纳米纤维素凝胶可作为井下流体助剂,不发生体积收缩;可用于钻井液降滤失剂、页岩抑制剂、增稠剂等,改善相关流体的性能。《石油工程科技动态》所有信息编译于国外石油公司网站、发表的论文、专利等,若需转载,请注明出处!中国石化石油工程技术研究院战略规划研究所
纤维素的结构及性质
一.结构 纤维素是一种重要的多糖,它是植物细胞支撑物质的材料,是自然界最非丰富的生物质资源。在我们的提取对象-农作物秸秆中的含量达到450-460g/kg。纤维素的结构确定为β-D-葡萄糖单元经β-(1→4)苷键连接而成的直链多聚 体,其结构中没有分支。纤维素的化学式:C 6H 10 O 5 化学结构的实验分子式为 (C 6H 10 O 5 ) n 早在20世纪20年代,就证明了纤维素由纯的脱水D-葡萄糖的重复 单元所组成,也已证明重复单元是纤维二糖。纤维素中碳、氢、氧三种元素的比例是:碳含量为44.44%,氢含量为6.17%,氧含量为49.39%。一般认为纤维素分子约由8000~12000个左右的葡萄糖残基所构成。 O O O O O O O O O 1→4)苷键β-D-葡萄糖 纤维素分子的部分结构(碳上所连羟基和氢省略)二.天然纤维素的原料的特征 做为陆生植物的骨架材料,亿万年的长期历史进化使植物纤维具有非常强的自我保护功能。其三类主要成分-纤维素、半纤维素和木质素本身均为具有复杂空间结构的高分子化合物,它们相互结合形成复杂的超分子化合物,并进一步形成各种各样的植物细胞壁结构。纤维素分子规则排列、聚集成束,由此决定了细胞壁的构架,在纤丝构架之间充满了半纤维素和木质素。天然纤维素被有效利用的最大障碍是它被难以降解的木质素所包被。 纤维素和半纤维素或木质素分子之间的结合主要依赖于氢键,半纤维素和木质素之间除了氢键外还存在着化学健的结合,致使半纤维素和木质素之间的化学健结合主要在半纤维素分子支链上的半乳糖基和阿拉伯糖基与木质素之间。 表:植物细胞壁中纤维素、半纤维素、和木质素的结构和化学组成
微晶纤维素
微晶纤维素是一种白色、无臭、无味、多孔、易流动粉末,不溶于水、烯酸、氢氧化钠溶液及一般有机溶剂。聚合度约220,结晶度高。为高度多孔颗粒或粉末。 一、微晶纤维素主要有三大特性: 1、吸附性:为多孔性微细粉末,可以吸附其他物质如水、油及药物等。比表面积随无定形 区比例的增大而增大。 2、分散性:微晶纤维素在水中经剧烈搅拌,易于分散生成奶油般的凝胶体。胶态微晶纤维 素因含有亲水性分散剂,在水中能形成稳定的悬浮液,程不透明的“奶油”状或凝胶状。 3、反应性能:在稀碱液中少部分溶解,大部分膨化,表现出较高的反应性能。 二、微晶纤维素在国内应用领域: 1、医药卫生:①微晶纤维素分子之间存在氢键,受压时氢键缔合,故具有高度的可压性, 常被用作于粘合剂;压制的片剂遇到液体后,水分迅速进入含有微晶纤维素的片剂内部,氢键即刻断裂,因此可做为崩解剂。此外微晶纤维素的密度较低,比溶剂较大,粒度分布较宽,又常被用作稀释剂。②医药行业中MCC主要被用在两个方面,一是利用他在水中强搅拌下易于形成凝胶的特性,用于制备膏状或悬浮状类药物;二是利用其成型作用,而用于医用压片的赋形剂。目前医药行业中压片赋形剂可分为两类,一是传统方法使用淀粉赋形剂;第二类是利用新型的纤维素赋形剂。使用淀粉的工艺必须经过造粒阶段,而使用MCC则因为其流动性好,本身具有一定的粘合性直接压片,因此能工艺简化,生产效率得以提高,例外使用MCC还有服用后崩解效果好、药效快、分散好等优点,因此使用MCC在压片赋形剂上得以广泛推广应用。 2、微晶纤维素在食品工业领域的应用:
微晶纤维素作为食品添加剂的主要作用有:泡沫稳定性;高温稳定性;液体的胶化剂; 悬浮剂;乳化稳定性等。其中乳化稳定性是微晶纤维素在食品工业领域最主要的功能。 3、微晶纤维素在轻工化工领域的应用: ①陶瓷业:陶瓷厂在陶土中添加微晶纤维素,不仅能增湿坯强度,提高半成品率,而 且焙烧时烧除微晶纤维质使陶瓷具有质轻透明的特色。 ②玻璃业:微晶纤维素胶液能在玻璃表面形成极黏的膜涂层,能为玻璃纤维提供纤维 素的表层,使其能用一般的纺织机器加工。 ③涂料业:在涂料中添加微晶纤维素,能使涂料具有触变性,以控制涂料的粘度、流 动性及涂刷性能。 4、微晶纤维素在日常化学工业中的应用: ①某些等级的微晶纤维素用于化妆及皮肤护理品的制造,甚至包含尿素这样难以掺和 的配料,同起耐热稳定剂的作用。 ②微晶纤维素与细砂、高岭土等混合,可制成含磨料的卫浴、厨房及手部皮肤的清洁 剂。 ③将微晶纤维素与羧甲基纤维素钠盐、有机物及水混合,可制成服装洗涤过程的保护 性胶体。 三、医药行业中微晶纤维素用于粉末直接压片的特点: ①可以使易吸潮的药物(土霉素、食母生、酵母片等)避免湿热的阴影,克服粘冲、 劣片的现象,有利于提高片剂的质量。
利用X射线衍射法测定竹材纤维素结晶度
粗纤维素提取及测定方法 一、仪器用具: 粉碎机一台,研钵、水力抽气装置一套,恒温水浴一台,万分之一天平一台,100mL三角瓶两个,150mL容量瓶一只,50mL、100 mL 量筒各一个,10mL吸管一只,可控电烘箱一台,电炉一个,古氏干锅两只(25mL),干燥器,1.0mm圆孔筛,两个1000mL的容量瓶。 二、试剂 1,醋酸和硝酸混合液:取10mL比重1.4的硝酸加到100mL80%的硝酸中,充分混匀,保存于容量瓶中。 2,乙醇、乙醚。 3,酸洗石棉;用1.25%碱洗液至中性,在用乙醇、乙醚先后各洗三次,待乙醚挥发净备用。 4,脱脂棉。 三、原理; 根据纤维素性质较稳定的特点,试样用乙酸和硝酸混合液加热处理,淀粉、多缩戊糖、木质素、半纤维素、色素、单宁和脂肪等其他物质,受到水解而被基本除去,纤维素被保留下来,采用抽滤法滤出纤维,在分别用水、乙醇、乙醚除去水溶性、醇溶性、脂溶性物质,然后把残渣烘干称重,计算粗纤维素含量。 四、操作方法 1、试样处理:取净样50g用40目筛底粉碎,然后用1.0mm圆孔筛筛选,残留下的用研钵研碎,使之通过1.0mm圆孔筛,装入磨口瓶中备
用。 2、准备抽气装置:用胶管连接抽气泵、抽气瓶、连接好水源。用蒸馏水将备用的石棉分成粗细两部分,先去粗的,后用细的石棉铺垫,厚度均匀不透光为宜,用少量的乙醇、乙醚分别倾入坩埚进行抽洗,将坩埚送入105℃箱内烘干至恒重。 3、硝化处理:称取试样1g左右,倒入100mL三角瓶中,加入25mL 醋酸和硝酸的混合液,盖上容量瓶盖,放入98℃水浴中(一般浸入水中1.5cm)。准确加热20分钟,倒是取出用冷水冷却至室温,倾入坩埚中进行抽泣过滤。用热水洗净附着瓶壁上的纤维素(注意不要把泥沙倒入坩埚内)。用水洗去酸液,再用20ml乙醇、乙醚先后各分成两次洗涤,再用脱脂棉擦干净外部,送入105℃的烘箱中烘至恒重。 4、结果计算: 粗纤维%(干基) = % 100 ) 100 ( 1 2? - - M W W W 式中:W~试样重量; W2~粗纤维和坩埚重量; W1~坩埚重量; M~水分百分比。 注:1)用本方法消化时, 对温度较敏感, 应十分注意温度的控制, 一般将水加热沸腾, 去掉离电热管较远的两孔盖子即可达到98℃。 2)坩埚铺垫不宜过薄, 因细小纤维素会漏掉, 过厚过滤困难。 3)三角瓶上加盖子目的是:(a)加强三角瓶在水中的稳定性;(b)
纳米晶体纤维素的生产挑战及使用领域
纳米晶体纤维素的生产挑战及使用领域 纳米晶体纤维素可以从多种纤维素来源中分离出来,下面是搜集的一篇关于纳米晶体纤维素提取应用探究的,欢迎阅读参考。 众所周知,纤维素是可再生的聚合物资源,被认为是一种取之不尽用之不竭的原料,从纤维素中提取出的纳米晶体纤维素(nanocrystallinecel-lulose,NCC)是最丰富的生物聚合物,也是最有潜力的材料。 分离提取NCC需要经过两个阶段。第一阶段是原材料的预处理,即对木材和植物(包 含基质材料---半纤维素、木质素等)的完全或部分分离以及分离有纤维质的纤维。第二阶 段是受控制的化学处理,通常水解作用除去纤维素聚合物的无定型区。本文概述了NCC 的提取方法及过程,并分析了生产NCC所面临的挑战和NCC的应用范围及领域,以期为NCC的相关研究提供参考。 1、纳米晶体纤维素的提取 纳米晶体纤维素(NCC)可以从多种纤维素来源中分离出来,包括植物、动物(被囊)、 细菌和藻类等。NCC几乎可以从任何纤维素材料中萃取出来,在实践过程中,研究人员 倾向于从木材、植物和一些相对较纯的纤维素如微晶纤维素(mi-crocrystallinecellulose,MCC)或漂白的牛皮纸浆等原料中提取。木材因其天然丰度、广泛 的利用度和高含量的纤维素而成为纤维素的主要来源。 由于上述几种原料易得到,可以保证实验室提取出NCC的纯度[1],还可以从MCC、 滤纸或相关产品中精制出NCC.此外,被囊动物的长度和高结晶度[2]使其成为备受青睐的NCC来源,虽然它的广泛使用受到高成本收割和有限利用率的限制。 1.1木质纤维素生物质的预处理 木材和植物等原料的预处理过程相似,采用的是在纸浆和造纸工业中通常使用的技术。在实践中,木质素阻碍木材分离成纤维,所以木质素脱离是生成NCC的必要步骤。例如Siquera等[3]和Smook等[4]描述了制浆和漂白过程,主要是由化学处理(制浆)的生物质 先切取解聚,并最终溶解木质素和半纤维素,之后用氧化剂(如氧气或NaClO2氧化)漂白。 蒸汽爆炸过程是另一个有效的预处理方法,用于将木质类生物质转化,最终达到分离纳米纤维的目的[5,6].在过去的二十年里,蒸汽爆炸的预处理技术一直是研究热点,特别 是因为其得到的原料更适合用于酶水解[7].在此过程中,生物质样品首先磨碎,然后在 200~270℃的温度下、14×105~16×105Pa的压力下进行短时间(20s~20min)的高压蒸汽 处理。打开蒸煮器后压力迅速下降,材料暴露于正常的大气压下引起爆炸导致木质纤维素
微晶纤维素2015版中国药典标准
微晶纤维素 Weijing Xianweisu Microcrystalline Cellulose C 6n H 10n+2O 5n+1 [9004-34-6] 本品系含纤维素植物的纤维浆制得的α-纤维素,在无机酸的作用下部分解聚,纯化而得。 【性状】本品为白色或类白色粉末或颗粒状粉末;无臭,无味。 本品在水、乙醇、乙醚、稀硫酸或5%氢氧化钠溶液中几乎不溶。 【鉴别】(1)取本品lO mg,置表面皿上,加氣化锌碘试液2ml,即变蓝色。 (2)取本品约1.3g ,精密称定,置具塞锥形瓶中,精密加25ml ,振摇使微晶纤维素分散并润湿,通入氮气以排除瓶中的空气,在保持通氮气的情况下,精密加lmol/L 双氢氧化乙二胺铜溶液25ml ,除去氮气管,密塞,强力振摇,使微晶纤维素溶解,作为供试品溶液;取适量,置25℃士0.1℃ :水浴中,约5分钟后,移至乌氏黏度计内(毛细管内径为 0.7?1.0mm ,选用适宜黏度计常数),照黏度测定法(通则 0633第二法),于25℃士0.1℃ 水浴中测定。记录供试品溶液流经黏度计上下两刻度时的时间A ,按下式计算供试品溶液的运动黏度ν1: ν1=t 1 × K 1 分别精密量取水和lmol/L 双氢氧化乙二胺铜溶液各25ml ,混匀,作为空白溶液,取适量,置25℃士0.1℃水浴中,约5分钟后,移至乌氏黏度计内(毛细管内径为0.5?0.6mm,黏度计常数约为0.01),照黏度测定法(通则0633第二法),于25℃士0.1℃水浴中测定。记录空白溶液流经黏度计上下两刻度时的时间按下式计算空白溶液的运动黏度v2: ν1=t 2× K 2 照下式计算微晶纤维素的相对黏度: ηrel =ν1/ν2 根据计算所得的相对黏度值(ηrel ),査附表,得〔特性黏数[>](ml/g)和浓度C(g/100ml)的乘积〕,计算聚合度(P),应不得过350。 式中m 为供试品取样量,g ,以干燥品计算。
纳米纤维素晶体
南京林业大学 课程设计报告 题目:纤维素纳米晶的制备与性能 学院:理学院 专业:材料化学 学号:101103227 学生姓名:朱一帆 指导教师:郭斌 职称:副教授 二0一三年十二月三十日
摘要 纤维素是自然界中最丰富的天然高分子聚合物之一,不仅是植物纤维原料主要的化学成分,也是纸浆和纸张最主要、最基本的化学成分。由于其天然性和生物可降解性,在现在能源缺乏的时代,纤维素有很大的发展空间。纳米纤维素是直径小于100nm 的超微细纤维,也是纤维素的最小物理结构单元元;与非纳米纤维素相比,纳米纤维素具有许多优良特性,如高结晶度、高纯度、高杨氏模量、高强度、高亲水性、超精细结构和高透明性等,加之具有天然纤维素轻质、可降解、生物相容及可再生等特性,其在造纸、建筑、汽车、食品、化妆品、电子产品、医学等领域有巨大的潜在应用前景。 本文介绍了纳米纤维素晶体(NCC)及其一些制备方法、性质、研究现状和应用,展望了NCC作为一种纳米材料的美好前景,是21世纪可持续发展研究的重要课题。 关键词:纳米纤维素晶体;制备方法;性质;应用
Abstract Cellulose is one of the nature's most abundant natural polymers,not only the main chemical components of the plant fiber materials , pulp and paper but also the most important and basic chemical composition of the pulp and paper. Due to its natural and biodegradable cellulose has much room for development in the era of the lack of energy. Nano-cellulose is ultra-fine fibers of less than 100 nm in diameter, the smallest physical structure of the cellulose unit Dollar;compared with non-nano-cellulose, nano-cellulose has many excellent characteristics such as high crystallinity, high purity, high Young's modulus, high strength, high hydrophilicity, the hyperfine structure, and high transparency, https://www.wendangku.net/doc/a67290091.html,bined with the characteristics of natural cellulose lightweight, biodegradable, biocompatible and renewable, so it has huge potential applications in the field of paper, construction, automotive, food, cosmetics, electronic products and medical. This article describes what's the NCC and some preparation methods, nature, current research and applications. And looking up theNCC as a prospect of a better future nanomaterials. This research is an important issue for sustainable development in the 21st century. Key words: Nanocrystallinecellulose; preparation methods; properties;applications
纤维素的聚集态结构及其五种变体
纤维素的聚集态结构及其五种变体 纤维素的聚集态结构是研究纤维素分子间的相互排列情况(晶区和非晶区、晶胞大小及形式、分子链在晶胞内的堆砌形式、微晶的大小)、取向结构(分子链和微晶的取向)等。天然纤维素和再生纤维素纤维都存在结晶的原纤结构,由原先结构及其特性可部分地推知纤维的性质,所以为了解释以纤维素为基质的材料的结构与性能关系,寻找制备纤维素衍生物的更有效方法,则研究纤维素合成的机理、了解纤维素的聚集态结构,在理论研究和实际应用方面都有重要的意义。 为了深入研究纤维素的聚集态结构,必须了解纤维素的各种结晶变体,这些结晶变体都以纤维素为基础,有相同的化学成分和不同的聚集态及结构。纤维素有五类多种结晶变体(同质异晶体,polymorph),即纤维素Ⅰ、纤维素Ⅱ、纤维素Ⅲ1、纤维素Ⅲ2、纤维 素Ⅳ1、纤维素Ⅳ2、纤维素Χ,他们之间可以互相转化。 纤维素Ⅰ是纤维素天然存在形式,又叫原生纤维素,包括细菌纤维素、海藻和高等植物(如棉花、麻、木材等)细胞中存在的纤维素。由于Χ射线衍射设备和研究方法的改进,特别是计算机模拟技术的应用,从20世纪70年代起,应用模型堆砌分析方法已能够定量地确定纤维素及其衍生物链构象中的键长、键角配糖扭转角(φ和ψ)、配糖角(τ)、测基-CH2OH的旋转角(X),链的极性、旋转和相对位移及分子内和分子间的氢键,这使纤维素晶胞架构的研究建立在全新的近代科学基础上,并取得了重大进展。关于纤维Ⅰ晶胞的结构,主要的突破是解决了链极性(即方向)的问题。这方面研究以美国的Blackwell和Sarko 为代表。 纤维素Ⅱ是原生纤维素经由溶液中再生或丝光化得到的结晶变体,是工业上使用最多的纤维素形式。除了在Halicystis海藻中天然存在外,纤维素Ⅱ可以用以下四种方法制得:以浓碱液(较合适的浓度是11%--15%)作用于纤维素而生成碱纤维素,再用水将其分解为纤维素;将纤维素溶解后再从溶液中沉淀出来;将纤维素酯化后,再皂化成纤维素;将纤维素磨碎后,用热水处理。这种结晶变体与纤维素有很大的不同。 纤维素Ⅲ是用液态氨润胀纤维素所生成的氨纤维素分解后形成的一种变体,是纤维素的第三种结晶变体也称氨纤维素。也可将原生纤维素或纤维素Ⅱ液氨或胺类处理,再将其蒸发得到,是纤维素的一种低温变体。从纤维素Ⅱ中得到的纤维素Ⅲ与从原生纤维素得到的纤维素Ⅲ不同,分别称为纤维素Ⅲ2和纤维素Ⅲ1.纤维素Ⅲ的出现有一定的消晶作用,当氨或胺除去后,结晶度和分子排列的有序度都明显下降,可及度增加。 纤维素Ⅳ是由纤维素Ⅱ或Ⅲ在极性液体中以高温处理而生成的,故有高温纤维素之称,是纤维素的第四种结晶变体。一般它是通过将纤维素Ⅰ、Ⅱ、Ⅲ高温处理而得到的,因此以母题原料的不同,纤维素Ⅳ也分为纤维素Ⅳ1和Ⅳ2,纤维素Ⅳ1的红外光谱与纤维素Ⅰ相似,纤维素Ⅳ2的红外光谱与纤维素Ⅱ相似。纤维素Ⅳ1与纤维素Ⅳ2氢键网形成情况还有待进一步研究。 纤维素X 是纤维素经过浓盐酸(38-40.3%)处理而得到的纤维素结晶变体。其X射线图类似纤维素Ⅱ,而晶胞大小又与纤维素Ⅳ相近,实用性不大,研究报道较少。 将纤维素分为五类,是理想的五种形式,其实由于处理方法和技术差异,不同的纤维素晶型会存在于同一纤维素样品中。
微晶纤维素
简介 微晶纤维素 拼音名:Weijing Xianweisu 英文名:Microcrystalline Cellulose 书页号:2000年版二部-978 本品系纯棉纤维经水解制得的粉末,按干燥品计算,含纤维素应为97.0%~102.0%。 性状 本品为白色或类白色粉末,无臭,无味。本品在水、乙醇、丙酮或甲苯中不溶。 鉴别 取本品10mg,置表面皿上,加氯化锌碘试液2mg ,即变蓝色。 检查 细度取本品20.0g ,置药筛内,不能通过七号筛的粉末不得过5.0%,能通过九号筛的粉末不得少于50.0%。酸碱度取本品2.0g,加水100ml ,振摇5分钟,滤过,取滤液,依法测定(附录ⅥH),pH值应为5.0 ~7.5 。水中溶解物取本品5.0g,加水80ml,振摇10分钟,滤过,滤液置恒重的蒸发皿中,在水浴上蒸干,并在105℃干燥1小时,遗留残渣不得过0.2%。氯化物取本品0.10g,加水35ml,振摇,滤过,取滤液,依法检查(附录Ⅷ A),与标准氯化钠溶液3.0ml制成的对照液比较,不得更浓(0.03%) 。淀粉取本品0.1g,加水5ml ,振摇,加碘试液0.2ml ,不得显蓝色。干燥失重取本品,在105 ℃干燥至恒重,减失重量不得过5.0 %(附录Ⅷ L)。炽灼残渣取本品1.0g,依法测定(附录Ⅷ N),遗留残渣不得过0.2 %。重金属取炽灼残渣项下遗留的残渣,依法检查(附录Ⅷ H第二法)含重金属不得过百万分之十。砷盐取本品1.0g,加氢氧化钙1.0g,混合,加水搅拌均匀,干燥后,先用小火烧灼使炭化,再在600 ℃炽灼使完全灰化,放冷,加盐酸5ml 与水23ml使溶解,依法检查附录Ⅷ J第一法),应符合规定(0.0002%)。 含量测定 取本品约0.125g,精密称定,置锥形瓶中,加水25ml,精密加重铬酸钾溶液(取基准重铬酸钾4.903g,加水适量使溶解并稀释至200ml )50ml,
对纳米纤维素的制备自己的一点想法
加之以前对纳米纤维素的了解和最近看的有关纳米纤维素制备的资料。对于目前纳米纤维素的制备无非就是化学、生物合成、机械物理、人工合成等方法。但是这几种方法的缺陷又使得纳米纤维素的制备在工业化量产过程中又遇到了瓶颈问题。像以强酸处理为代表的的化学方法,反应设备要求高、回收和处理残留物困难,酸量大,产率低;而生物合成方法,所使用的细菌不受控制,耗时长,成本高,价格高;机械物理方法,能耗比较高,制得纤维素尺寸基本不够纳米级别;人工合成好像正好相反,合成的纤维素晶体颗粒又太小。综合以上几种方法可以看出,现在所采用的纳米纤维素制备方法基本都是‘杀敌一千,自损八百’的状态。如何找到一种高效率制得纳米纤维素的方法,又能把制备纤维素成本降到可以转化为工业生产,这样才能真正的推动纳米纤维素与化学、物理学、生物学及仿生学交叉结合产业的发展。 既然几种单一的方法不能高纯度的制备纳米纤维素,为何不换一种思路,两种方法结合起来制备是否效果会更好?根据木材纤维细胞的微细纤维的微细结构分析,原细纤维与原细纤维之间是聚糖通过分子间的作用相连接。所以要实现对原细纤维的分离可先对聚糖与原细纤维的链接部位用定向同位素或者荧光标记元素(是什么化学元素不知道,待以后去探知。假设存在)对其进行标记以得到定位的目的;接下来用可以识别标记同位素或荧光标记元素的定向靶向分子或者射线分子(是什么分子或者射线分子不知道,待以后探知。假设存在)对其进行定向爆破,达到对原细纤维定向剥离的目的。然后再机械分
离理论上就可得到纯度极高的纳米纤维素。 靶向分子定向爆破法步骤 定向标记后的模型 微细纤维微细结构模型 靶向分子定向爆破模型 对原细纤维与聚糖链 接部位进行标记 靶向分子定向爆破 原细纤维剥离
药用辅料—微晶纤维素(MCC)在药剂上的应用
药用辅料—微晶纤维素(MCC)在药剂上的应用 尹建1黄桂华2杨春凤1 1山东阿华制药有限公司,山东聊城252000;2山东大学药学院,山东济南250012 一、前言 药用辅料(pharmaceutical excipients)广义上指的是能将药理活性物质制备成药物制剂的各种添加剂。国际药用辅料协会(IPEC)的定义是:药用辅料是药品制剂成型时,以保持稳定性、安全性或均质性,或为适应制剂的特性以促进溶解、缓释等为目的而添加的物质。它的作用有:(1)在药物制剂制备过程中有利于成品的加工;(2)加强药物制剂的稳定性,提高生物利用度和病人的顺应性;(3)有助于从外观鉴别药物制剂;(4)增加药物制剂在贮存或应用时的安全性或有效性。 近年来国内外对药物制剂的要求,不仅有药物的纯度、均匀溶出度(释放度)和稳定性等,而且要求药物在体内达到所需的血药浓度(生物利用度),以提高药物的治疗效果,减少副作用。为此,应用新型的辅料,研究新工艺和新剂型,已成为国内外制剂工作者的重要手段。随着药用高分子材料的发展,制剂新辅料正在不断涌现。 微晶纤维素(MCC)是由天然纤维经强酸在加热条件下水解后除去其中无定形纤维而得到的棒状或颗粒状的晶体。微晶纤维素分子之间存在氢键,受压时氢键缔合,故具有高度的可压性,常被用作于粘合剂;压制的片剂遇到体液后,水分迅速进入含有微晶纤维素的片剂内部,氢键即刻断裂,因此可作为崩解剂。此外,微晶纤维素的密度较低,比容积较大,粒度分布较宽,又常被用于作稀释剂。因此它是片剂生产中广泛使用的一种辅料。目前在国内外.根据微晶纤维素的物理化学性能不同,巳形成多种规格品种,广泛应用于医药、食品、化妆品、轻化工、农业等各生产部门。由于它具有多方面的功能作用和优良性能,国内外需求日益增长,且新用途正在不断地被开发出来,某些药用微晶纤维素品种巳形成系列化。 MCC目前进入国内市场的有德国JRS公司、日本旭化成株式会社等,其中德国JRS公司规格较齐全,质量较佳,受到市场欢迎。最常用有PH102、103、301、112、200等可直接压片,PROSOLV技术的应用,使MCC具有更好的流动性和亲水性,对药物有较大的吸附力,加速了片剂的崩解,增加了难溶性药物的溶出度和生物利用度。国内山东阿华制药有限公司等生产的MCC,其质量可与德国JRS公司的产品相媲美,在国内市场供不应求。 二.MCC在制剂上应用 医药行业中MCC主要被用作两个方面,一是利用它在水中强力搅拌下易于形成凝胶的特性,而用于制备膏状或悬浮状类药物;二是利用其成型作用,而用于医药压片的赋型剂。目前,医药行业中压片赋型剂可分成两类。一类是传统的方法,使用淀粉赋型剂;第二类是使用新型的纤维素赋型剂。使用淀粉的工艺必须经过造粒阶段。而使用MCC则因为其流动性好,本身具有一定的粘合性而能直接压片.因此能使工艺简化,生产效率得以提高。另外.使用MCC,还有服用后崩解力好、药效快、分散好等优点,因而使MCC在压片赋型剂上得以广泛应用。
纤维素的大分子结构
第三节棉纤维的结构 棉纤维的结构一般包括大分子结构、超分子结构和形态结构。棉纤维的性能基本上由这些结构所决定。因此,了解棉纤维结构可为检验棉花品质提供理论基础。 一、棉纤维的大分子结构 成熟的棉纤维绝大部分由纤维素组成。纤维素是天然高分子化合物,其分子式为(C6H10O5),大分子结构式如图1-3所示。 图1-3 纤维素大分子结构式 纤维素是一种多糖物质,每个纤维大分子都是由n个葡萄糖剩基,彼此以1-4苷键联结而形成的。所以,纤维素大分子的基本链节是葡萄糖剩基,在大分子结构式中为不对称的六环形结构,也称“氧六环”。相邻两个氧六环彼此的位置扭转180°,依靠苷键连成一个重复单元,即大分子单元结构是纤维素双糖,长度为1.03nm,是纤维素大分子结构的恒等周期。纤维素大分子的空间结构,如图1-4所示。 图1-4 纤维素大分子空间结构示意图 纤维素大分子的官能团是羟基和苷链。羟基是亲水性基团,使棉纤维具有一定的吸湿能力;而苷键对酸敏感,所以棉纤维比较耐碱而不耐酸。此外,纤维素大分子中氧六环之间距离较短,大分子之间羟基的作用又较多,所以纤维素大分子的柔曲性较差,是属于较僵硬的线型大分子,棉纤维表现为比较刚硬,初始模量较高,回弹性质有限。 二、棉纤维的超分子结构 超分子结构是指大于分子范围的结构,又称“聚焦态结构”。 (一)大分子间的结合力 棉纤维中大分子之间是依靠分子引力(又称“范德华力”)和氢键结合的。 1.分子引力 分子引力是永远存在分子间的一种作用力,是由偶极分子之间的静电引力、相邻分子之间诱导电动势引起的诱导力以及相邻原子上电子云旋转引起瞬间偶极矩产生的色散力综合组成。它的强度比共价键的强度小得多,而且与分子间的距离有关,作用距离约为0.3-0.5nm,当分子间距离大于0.5nm时,这种作用力可忽略不计。 2.氢键 氢键是大分子侧基上(或部分主链上)极性基团之间的静电引力。它的结合力略大于分子引力,在作用距离约0.23-0.32nm条件下能使相邻分子较稳定地结合。 (二)结晶态和非结晶态 纤维中大分子的排列是比较复杂的,一般存在两种状态,即某些局部区域呈结晶态,另一些局部区域呈非结晶态。纤维中大分子在规律地整齐排列的状态都叫“结晶态”,纤维中呈现结晶态的区域叫“结晶区”。在纤维的结晶区中,由于大分子排列比较整齐密实,缝隙孔洞较少,分子之间互相接近的各个基团的结合力互相饱和,因而纤维的吸湿较困难,强度较高,变形较小。棉纤维结晶区内结晶结构的最小单元,即单元晶格是由五个平行排列的纤维素大分子在两个氧六环链节长的一段上组成,中间的一个大分子与棱边的四个大分子是倒向的。不同种类的纤维素纤维其晶胞尺寸是不相同的。棉纤维和麻纤维单元晶格的尺寸为a=0.835nm,b=1.03nm,c=0.795nm,?=84°,称为“纤维素Ⅰ晶胞”,如图1-5所示。粘胶
药用辅料—微晶纤维素(MCC)在药剂上的应用
企业名称:山东阿华生物药业有限公司 该企业的母公司为上市公司,有着雄厚的资金实力。公司主导产业基因工程药物纳入山东省高新技术产业发展规划,享受上市公司、省级技术开发中心、GMP认证厂家、山东省高新技术企业等优惠政策。公司所在地占地面积大,周围无污染,适宜基因工程药物的生产,而且人力、生产成本低,发展空间广阔。公司在济南与山东省医学科学院基础医学研究所联合建立了负责基因工程药物上游技术开发的山东阿华生物技术研究所,该所共有研究人员20人,其中研究员、副研究员10人,硕士、博士8人,留美、英、日人员5人,在基因工程药物的开发、肿瘤生物治疗技术应用研究方面处于国内领先水平,留美归国博士、所长田志刚先后主持完成了19项国家、省、部级科研项目。公司在上海与华东理工大学联合建立了负责基因工程药物下游技术研究的上海阿华生物工程研究所,该所共有研究人员15人,其中硕士以上的8人,该所在EPO工业生产工艺、大规模培养杂交瘤细胞生产体内治疗用单抗、细胞培养用生物反应器的研制和应用等方面处于国际领先和先进水平。所长张元兴教授为博士生导师、国家863专家组成员,多次主持国家863计划、国家科技攻关项目。公司法人代表章安为全国优秀科技工作者,享受国务院专家津贴,在中成药、基因工程药物的研究与开发和企业管理方面颇有建树。母公司驰名中外,有着极高的企业及品牌信誉,在全国设有40多个营销分公司,其中具有医学专业学历的高级营销人员68人,形成了功能齐全、覆盖全国的营销网络。两所、一基地、一网形成了符合科研和市场规律的基因工程产业链。
药用辅料—微晶纤维素(MCC)在药剂上的应用 1山东阿华制药有限公司,山东聊城252000 一、前言 药用辅料(pharmaceutical excipients)广义上指的是能将药理活性物质制备成药物制剂的各种添加剂。国际药用辅料协会(IPEC)的定义是:药用辅料是药品制剂成型时,以保持稳定性、安全性或均质性,或为适应制剂的特性以促进溶解、缓释等为目的而添加的物质。它的作用有:(1)在药物制剂制备过程中有利于成品的加工;(2)加强药物制剂的稳定性,提高生物利用度和病人的顺应性;(3)有助于从外观鉴别药物制剂;(4)增加药物制剂在贮存或应用时的安全性或有效性。 近年来国内外对药物制剂的要求,不仅有药物的纯度、均匀溶出度(释放度)和稳定性等,而且要求药物在体内达到所需的血药浓度(生物利用度),以提高药物的治疗效果,减少副作用。为此,应用新型的辅料,研究新工艺和新剂型,已成为国内外制剂工作者的重要手段。随着药用高分子材料的发展,制剂新辅料正在不断涌现。 微晶纤维素(MCC)是由天然纤维经强酸在加热条件下水解后除去其中无定形纤维而得到的棒状或颗粒状的晶体。微晶纤维素分子之间存在氢键,受压时氢键缔合,故具有高度的可压性,常被用作于粘合剂;压制的片剂遇到体液后,水分迅速进入含有微晶纤维素的片剂内部,氢键即刻断裂,因此可作为崩解剂。此外,微晶纤维素的密度较低,比容积较大,粒度分布较宽,又常被用于作稀释剂。因此它是片剂生产中广泛使用的一种辅料。目前在国内外.根据微晶纤维素的物理化学性能不同,巳形成多种规格品种,广泛应用于医药、食品、化妆品、轻化工、农业等各生产部门。由于它具有多方面的功能作用和优良性能,国内外需求日益增长,且新用途正在不断地被开发出来,某些药用微晶纤维素品种巳形成系列化。 MCC目前进入国内市场的有德国JRS公司、日本旭化成株式会社等,其中德国JRS公司规格较齐全,质量较佳,受到市场欢迎。最常用有PH102、103、301、112、200等可直接压片,PROSOLV技术的应用,使MCC具有更好的流动性和亲水性,对药物有较大的吸附力,加速了片剂的崩解,增加了难溶性药物的溶出度和生物利用度。国内山东阿华制药有限公司等生产的MCC,其质量可与德国JRS公司的产品相媲美,在国内市场供不应求。 二.MCC在制剂上应用 医药行业中MCC主要被用作两个方面,一是利用它在水中强力搅拌下易于形成凝胶的特性,而用于制备膏状或悬浮状类药物;二是利用其成型作用,而用于医药压片的赋型剂。目前,医药行业中压片赋型剂可分成两类。一类是传统的方法,使用淀粉赋型剂;第二类是使用新型的纤维素赋型剂。使用淀粉的工艺必须经过造粒阶段。而使用MCC则因为其流动性好,本身具有一定的粘合性而能直接压片.因此能使工艺简化,生产效率得以提高。另外.使用MCC,还有服用后崩解力好、药效快、分散好等优点,因而使MCC在压片赋型剂上得以广泛应用。