Multiband Optical Photometry and Bolometric Light Curve of the Type Ia Supernova

a r X i v :a s t r o -p h /0504183v 1 7 A p r 2005
Mon.Not.R.Astron.Soc.000,1–??()Printed 2February 2008
(MN L A T E X style ?le v2.2)
Multiband Optical Photometry and Bolometric Light
Curve of the Type Ia Supernova 2004S
Kuntal Misra 1,Atish P.Kamble 2,D.Bhattacharya 2and Ram Sagar 1
1.Aryabhatta Research Institute of Observational Sciences,Manora Peak,Nainital,263129,India
2.Raman Research Institute,Bangalore,560080,India
(E-mail:kuntal@upso.ernet.in,atish@rri.res.in,dipankar@rri.res.in,sagar@upso.ernet.in)
Accepted.....;Received .....
ABSTRACT
We present BVR c I c broad band CCD photometry of the Type Ia supernova SN 2004S,which appeared in the galaxy MCG-05-16-021,obtained during 2004February 12to March 22.Multiband and bolometric light curves constructed using our data as well as other available data are presented.The time of B band maximum and the peak magnitudes in di?erent bands are obtained using the ?ts of light curve and colour templates.We clearly see a strong shoulder in R c band and a second maximum in I c band.SN 2004S closely resembles SN 1992al after maximum.From the peak bolometric luminosity we estimate the ejected mass of 56Ni to be 0.41M ⊙.Key words:supernovae:general -supernovae:individual:SN 2004S
1INTRODUCTION
In recent years signi?cant progress has been made in the study of Type Ia Supernovae (SNe),but many of their properties remain fairly uncertain.Supernovae of Type Ia are among the most luminous stellar out-bursts and because of the homogeneity in their proper-ties (H¨o ?ich et al.1996)have been regarded as standard-izable candles for determining extragalactic distances and deriving cosmological parameters.They are thought to be thermonuclear explosions of carbon-oxygen white dwarfs (Hoyle &Fowler 1960).However,Type Ia supernovae are suspected to be not a perfectly homogeneous group,from both their light curves and spectra (Pskovskii 1970,1977;Barbon,Ciatti,&Rosino 1973;Barbon et al.1990;Branch 1981;Elias et al.1985;Frogel et al.1987;Phillips et al.1987;Cristiani et al.1992).Some SNe have shown signi?-cant deviations such as SN 1991T (Filippenko et al.1992a;Phillips et al.1992;Je?ery et al.1992;Mazzali et al.1995)and SN 1991bg (Filippenko et al.1992b;Leibundgut et al.1993;Turatto et al.1997;Mazzali et al.1997).The classic Si II and Ca II lines were seen very late and with diminished strength in SN 1991T and its early spectrum was dominated by Fe III lines (Filippenko et al.1992a;Ruiz-Lapuente et al.1992)while the nebular phase was very similar to other SN Ia (Leibundgut et al.1993).SN 1991bg was a strongly sublu-minous event which established the existence of a wide range of luminosities among Type Ia supernovae (Filippenko et al.1992b;Leibundgut et al.1993).SN 1991bg showed an ab-sorption trough near 4000?A which was attributed to Ti II (λλ4395?A ,4444?A and 4468?A )absorption (Filippenko et al.
1992b;Mazzali et al.1997).Other supernovae showing re-markable deviations are SN 1999ac,a slow rise and fast de-cliner (Labbe et al.2001;Phillips et al.2003),SN 2000cx,a
fast riser and slow decliner had unusually blue (B-V)colours ~30days after blue maximum (Li et al.2001;Candia et al.2003),while SN 1986G (Phillips et al.1987)appeared to have properties between normal supernova and the extreme case of SN 1991bg.SN 1999by is a rare example of a “pecu-liar”,fast declining SN Ia.Recently Garnavich et al.(2004)presented detailed photometric and spectroscopic observa-tions of SN 1999by.It is one of the few SNe to show sig-ni?cant intrinsic polarization (Howell et al.2001).Li et al.(2003)describe the even stranger SN 2002cx,which had pre-maximum spectra like 1991T,a luminosity like SN 1991bg (subluminous event),a slow late time decline and uniden-ti?ed spectral lines.In spite of these di?erences in SNe Ia,they still seem to follow a few common patterns in their behavior (Leibundgut 2000).Of these,the correlation be-tween the linear decline rate and luminosity is the best known (Phillips 1993).The template ?tting or ?m 15(the number of magnitudes in B band by which the SN declines in the ?rst 15days after maximum)method (Hamuy et al.1996a;Phillips et al.1999),the multi-colour light curve shape correction (Riess et al.1996,1998),and the stretch factor (Perlmutter et al.1997)exploit this property of SNe Ia to determine their luminosities.
In this paper,we report optical photometry of the Type Ia supernova SN 2004S.This supernova (mag 16on red CCD images)was discovered on 2004February 3.54UT by Martin (2004)at Perth Observatory with the 0.61-m Perth/Lowell Automated telescope in the course of the Perth Automated
2Kuntal Misra et
al.
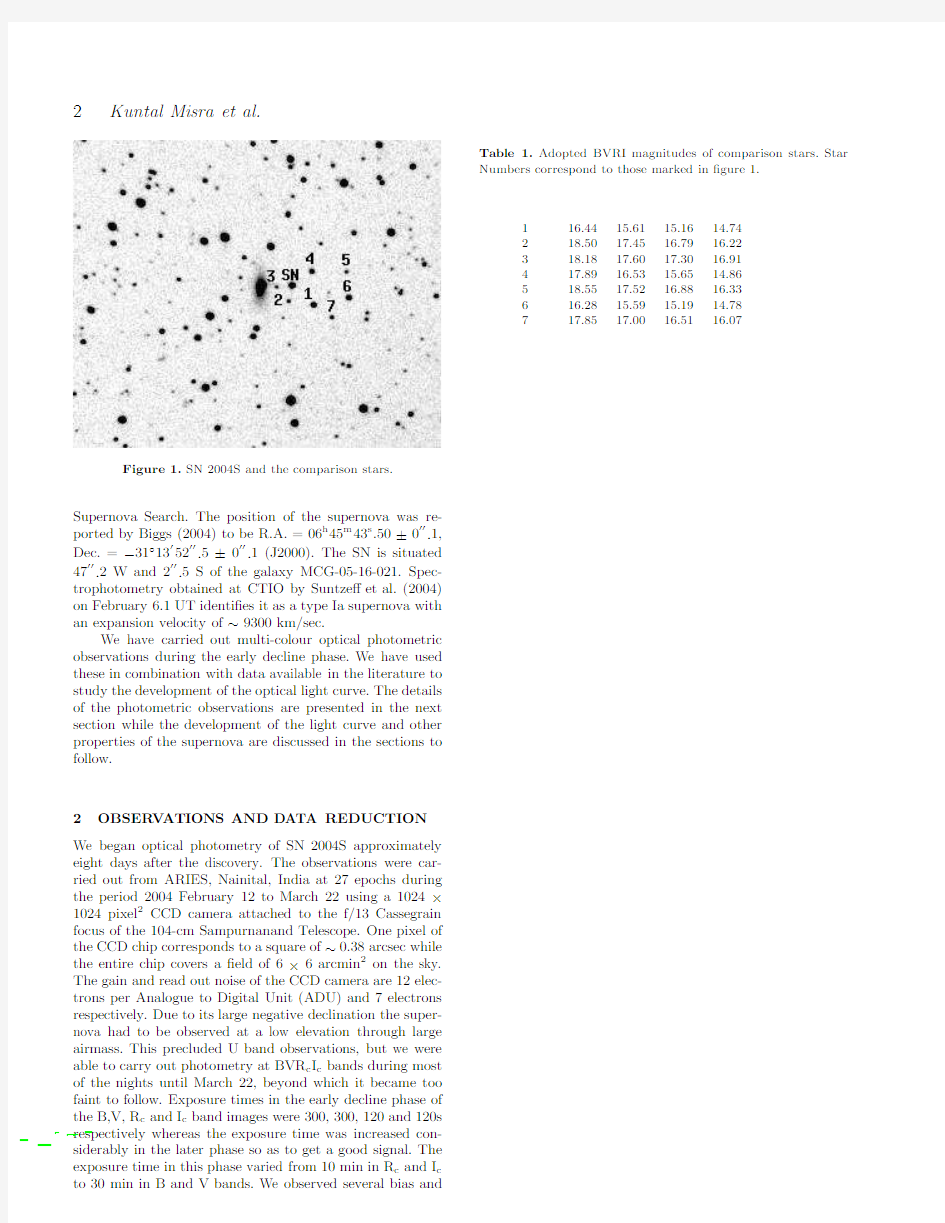
Figure1.SN2004S and the comparison stars. Supernova Search.The position of the supernova was re-ported by Biggs(2004)to be R.A.=06h45m43s.50±0′′.1, Dec.=?31?13′52′′.5±0′′.1(J2000).The SN is situated 47′′.2W and2′′.5S of the galaxy MCG-05-16-021.Spec-trophotometry obtained at CTIO by Suntze?et al.(2004) on February6.1UT identi?es it as a type Ia supernova with an expansion velocity of~9300km/sec.
We have carried out multi-colour optical photometric observations during the early decline phase.We have used these in combination with data available in the literature to study the development of the optical light curve.The details of the photometric observations are presented in the next section while the development of the light curve and other properties of the supernova are discussed in the sections to follow.
2OBSER V ATIONS AND DATA REDUCTION We began optical photometry of SN2004S approximately eight days after the discovery.The observations were car-ried out from ARIES,Nainital,India at27epochs during the period2004February12to March22using a1024×1024pixel2CCD camera attached to the f/13Cassegrain focus of the104-cm Sampurnanand Telescope.One pixel of the CCD chip corresponds to a square of~0.38arcsec while the entire chip covers a?eld of6×6arcmin2on the sky. The gain and read out noise of the CCD camera are12elec-trons per Analogue to Digital Unit(ADU)and7electrons respectively.Due to its large negative declination the super-nova had to be observed at a low elevation through large airmass.This precluded U band observations,but we were able to carry out photometry at BVR c I c bands during most of the nights until March22,beyond which it became too faint to follow.Exposure times in the early decline phase of the B,V,R c and I c band images were300,300,120and120s respectively whereas the exposure time was increased con-siderably in the later phase so as to get a good signal.The exposure time in this phase varied from10min in R c and I c to30min in B and V bands.We observed several bias and Table1.Adopted BVRI magnitudes of comparison stars.Star Numbers correspond to those marked in?gure1.
116.4415.6115.1614.74
218.5017.4516.7916.22
318.1817.6017.3016.91
417.8916.5315.6514.86
518.5517.5216.8816.33
616.2815.5915.1914.78
717.8517.0016.5116.07
Multiband Optical Photometry of SN2004S3 Table2.BVR c and I c magnitudes of SN2004S along with errors,Julian date and mid UT of observations are listed.
20040212.6142453048.114114.85±0.02214.58±0.04114.52±0.05114.76±0.062
20040213.6082453049.1088?14.75±0.043?14.88±0.061
20040214.6322453050.132815.17±0.02214.75±0.04214.64±0.05114.85±0.063
20040215.6772453051.1773??14.77±0.05214.85±0.061
20040218.6012453054.101115.48±0.02214.91±0.04114.91±0.05015.12±0.061
20040219.6052453055.105515.71±0.02314.98±0.04015.04±0.05115.11±0.061
20040220.6072453056.107015.76±0.02215.01±0.04015.01±0.05015.14±0.061
20040221.5922453057.092015.88±0.02215.07±0.04015.00±0.05215.15±0.061
20040222.6322453058.132716.00±0.02215.13±0.04015.07±0.05015.10±0.061
20040301.6182453066.1185?15.53±0.04215.15±0.051?
20040303.5872453068.0885?15.56±0.04115.20±0.05014.96±0.061
20040304.6122453069.1134?15.78±0.04215.37±0.05115.08±0.061
20040308.5912453073.0913?15.99±0.04915.56±0.06615.18±0.067
20040309.5802453074.082317.23±0.03316.02±0.04115.62±0.05115.28±0.061
20040310.5792453075.081417.31±0.02616.11±0.04115.73±0.05115.34±0.062
20040311.6002453076.104117.32±0.02816.13±0.04215.81±0.05215.38±0.064
20040312.5972453077.101117.41±0.03016.20±0.04115.87±0.05115.48±0.061
20040313.6112453078.115417.47±0.02916.25±0.04115.89±0.05115.47±0.061
20040314.6142453079.118217.58±0.02816.30±0.04215.94±0.05115.63±0.062
20040316.6022453081.106917.59±0.03816.41±0.04416.05±0.05215.74±0.062
20040317.6152453082.120017.62±0.02816.43±0.04116.11±0.05115.80±0.061
20040318.5982453083.102417.63±0.02716.43±0.04116.13±0.05115.83±0.061
20040319.5942453084.098817.66±0.03016.51±0.04116.17±0.05115.88±0.062
20040320.5972453085.101817.73±0.03116.52±0.04316.23±0.05215.96±0.062
20040321.6142453086.118417.74±0.02816.56±0.04116.25±0.05115.99±0.061
20040322.6152453087.119317.74±0.03016.56±0.04216.30±0.05116.05±0.062
/04S
4Kuntal Misra et al.
Since the complete data set includes data from di?er-ent telescopes and di?erent?lter systems in di?erent instru-ments there can be systematic di?erences in the estimated magnitudes(Suntze?2000).For example,Stritzinger et al. (2002)?nd systematic di?erence of0.05mag in pho-tometry by two di?erent telescopes(CTIO and YALO), even though the photometry is reduced to the same lo-cal standards.A method called“S-correction”,to bring photometry to a standard system,in such cases was sug-gested by Stritzinger et al.(2002).Krisciunas et al.(2003) and Krisciunas et al.(2004c)have applied these corrections to photometry of various SNe obtained using CTIO0.9m and YALO telescopes.To assess any such systematic di?er-ences between our data set and that from literature,we made B,V,I template?ts,discussed above,to these data sets in-dependently.We found no systematic di?erence in B band magnitudes of the two sets.However,our V magnitudes are fainter by0.03mag and I c magnitudes are brighter by0.05 mag compared to the literature data set.These di?erences are comparable to our observational errors.Hence,we do not?nd it necessary to apply S-correction to our data set while?tting templates to the combined data.
In Figure3we have included the BVI c template?ts to the data.The main parameters of SN2004S as estimated from template?ts are listed in Table4.For a typical SN Ia a two day di?erence is seen between the times of B and V maximum(Leibundgut1988).According to the best?t template,SN2004S would have reached maximum bright-ness in I c band slightly earlier than in B band and roughly two days later in V band.
Since our observations started~8days after the peak in the B band,we do not have observations at or around the epoch of B band maximum.An excellent match of the SN1992al light curve shape with that of SN2004S indicates that the peak in B band occurred at JD2453039.42.Though individual SNe can be di?erent in their light curve shapes,it seems unlikely that the peak magnitudes B(t B max),V(t B max) and I c(t B max)of SN2004S as inferred from the overall match of light curves with those of SN1992al would be much in error.As a consistency check,we compare the colours of SN 2004S at this epoch with those obtained using the intrin-sic colour curves of SN Ia population given by Nobili et al. (2003).
Nobili et al.(2003)present the intrinsic colour curves for a sample of48well observed nearby SN Ia for40days from the epoch of B max.We estimate total selective extinc-tion along the line of sight towards SN2004S comparing the observed colours with the intrinsic colour curves given by Nobili et al.(2003).Corresponding selective extinctions were taken as?t parameters.Best?t values of total selective extinctions thus obtained are listed in Column2of Table3. The shapes of observed colour curves are similar to the in-trinsic colour curves given by Nobili et al.(2003)except for systematic shifts in individual colour curves due to selective extinction.In Figure4,observed colour curves are plotted over intrinsic colour curves,corrected for the best?t values of selective extinction.
Independently,light curve template?tting gives B(t B max),V(t B max)and I c(t B max).From these we calculate another set of E(B?V),E(B?I c),E(V?I c)using intrin-sic colours at t B max(Nobili et al.2003).These values are listed in Column3of https://www.wendangku.net/doc/ae16307829.html,parison of the two sets of Table3.Selective extinction along the line of sight towards SN 2004S.Column2are the values obtained as a?t to the observed and intrinsic colours.Column3are the values at t(B max)obtained from the best?t template,intrinsic colours and galactic extinction law R v=3.1.Column4are the values obtained using best?t E(B?V)from colour curves and galactic extinction law R v=3.1. E(B?V)0.18±0.0540.20±0.0950.18±0.054
E(B?I c)0.34±0.0680.47±0.1120.40±0.122
E(V?R c)0.08±0.0680.10±0.031
E(V?I c)0.17±0.0730.27±0.1220.22±0.069
E(R c?I c)0.09±0.0760.12±0.037
Multiband Optical Photometry of SN 2004S
5
m a g
Days since B_max
Figure 3.UBVR c I c light curve of SN 2004S.The light curves are o?set by a constant value on the magnitude scale as indicated in the plot.Filled circles represent our data and open circles repre-sent data from Krisciunas (2004b).Uncertainties in the data are smaller than the size of the points.
B band peak magnitude obtained by the template ?t and the observed B band magnitude after ~15days of the B band peak.This gives a value of ?m 15=1.26±0.061.We estimated the average decline rate in all bands from our observations,using a time baseline of 10days starting ~8days after the B band peak,when our observations began.These decline rates are listed in Table 4.
4
ABSOLUTE LUMINOSITY AND BOLOMETRIC LIGHT CUR VE
Assuming H 0=65km sec ?1Mpc ?1and the radial veloc-ity of MCG-05-16-021corrected for Local Group infall onto Virgo as v r =2516km sec ?1as listed in LEDA (http://leda.univ-lyon1.fr/),we ?nd a distance modulus of 32.94mag.The total extinction estimated using the intrinsic colour curves of Nobili et al.(2003)are mentioned in table 3(column 2).From these,the absolute magnitudes estimated
at the time of B(t B max )in di?erent bands are M t B max
B =
?19.05±0.23,M t B max V =?18.96±0.18,M t B max
R c =?18.82
±0.15and M t
B max I c =?18.58±0.14.Altavilla et al.(2004)suggests another method for estimating absolute magnitude using a relation between M max and ?m 15.Adopting the values of linear ?t coe?cients of ?19.61±0.04and 1.10±0.15as given by Altavilla et al.(2004),we obtain M B max =
?19.43±0.08.The M max
B values obtained by the above two methods are in good agreement with each other.
Since most of the ?ux from an SN Ia emerges in optical bands during the ?rst few weeks (Suntze?1996),the integrated ?ux in UBVR c I c bands provides a meaningful estimate of the bolometric luminosity,which is directly related to the amount of radioactive nickel synthesized
Table 4.Parameters of SN 2004S
and ejected in the explosion.Supplementing our data in BVR c I c bands and with U band observations reported by Krisciunas (2004b),we construct a bolometric light curve using de-reddened magnitudes and the estimated distance modulus till ~40days after t B max .The ?rst U band observation was 3.105days after t B max .To estimate the contribution of U band at peak we assumed that the (U-B)colour remains constant from the peak to 3.105days.The magnitudes obtained were converted to ?ux using calibrations by Fukugita et al.(1995).The contribution from the U band at t B max is ~18.24%and that from the I c band is ~11.12%.We have not accounted for the contribution from JHK bands.In Figure 5we show the UVOIR bolometric light curve as a solid line from 0to 40days after t B max .The dash-dotted line in Figure 5shows the contribution derived from the BVI bands alone,as obtained from ?tted templates from ?5to 80days with reference to t B max .We derive a peak bolometric luminosity of L =8.715x 1042erg sec ?1.The bolometric peak is
6
Kuntal Misra et al.
-0.2 0 0.2 0.4
0.6V -
R
-0.5 0 0.5
1V -
I
0.5 1
1.5B -
V
1.5
B -
I
5
10
15
20
25
30
35
40
Days since B_max
R -I Figure 4.Color curves of SN 2004S.The middle (solid)line in each panel shows the extinction corrected colour curve bounded by errors (dashed lines)on both sides.Filled circles represent colours obtained from our observations,and open circles are from observations reported by others.
coincident in time with the B band peak within errors.We use the peak bolometric luminosity to derive 56Ni mass using the method outlined by Branch (1992).It is understood that radioactivity powers the light curve and near the time of maximum light most of the energy released by the radioactivity is still being trapped and thermalized.The peak radiated luminosity is expected to be comparable to the instantaneous rate of energy release by radioactivity (Branch 1992).The peak luminosity can be expressed as
L =αR(t R )M Ni
where αis a model dependent parameter expected to be of order unity,R is the radioactivity luminosity per unit nickel mass,evaluated at the time of maximum light t R (the rise time)and M Ni is the synthesized mass of 56Ni.The B band rise time (t R )is related to the post peak B band decline rate (β)in mag per 100days as t R =13+0.7β.In the case of SN 2004S β=8.45,which gives a rise time of 18.915days.
41.4
41.6
41.8
42
42.2
42.4
42.6
42.8
43
20
40
60
80
L o g (L u m i n o s i t y ) i n e r g /s e c
Days since B_max
Figure 5.Bolometric light curve for SN 2004S.The solid line shows the Bolometric light curve constructed from UBVR c I c bands and the dash-dotted line shows the bolometric light curve derived from BVI ?ts of Hamuy et al.(1996b).
For this value of t R ,R(t R )works out to be 2.108x 1043
erg sec ?1M ?1
⊙.The peak bolometric luminosity determined above then yields M Ni =0.41M ⊙for an assumed α=1.
Contardo et al.(2000)have calculated the bolometric luminosity and the ejected nickel mass for several SN Ia from UBVRI bolometric peak ?uxes.In Table 5we com-pare M B max ,?m 15,the peak bolometric luminosity and de-rived M Ni for SN 2004S with corresponding values for the sample of Contardo et al.(2000)and two other recent SNe Ia:1998bu (Hernandez et al.2000;Leibundgut 2000)and 1999aw (Strolger et al.2002).We ?nd that SN 2004S repre-sents a mid range value for M Ni ,similar to SN 1992A,SN 1992bo and SN 1994D.The subluminous event SN 1991bg is a fast decliner having a smaller value of Nickel mass ejected.SN 1991T,a peculiar and intrinsically bright supernova,has the largest value of derived M Ni in the table.More recently,observations of cepheids by HST has revised the distance to NGC 4527,the host galaxy of SN 1991T (Gibson &Stetson 2001).Also,possible JHK maxima of this supernova have been determined by Krisciunas et al.(2004c).These mea-surements indicate that SN 1991T was only slightly over-luminous,comparable to Type Ia SNe with similar values of ?m 15.Candia et al.(2003)point out another peculiar case of SN 2000cx as an underluminous event.Candia et al.(2003)have compared the bolometric light curves of SN 2000cx with SN 1999ee and SN 2001el.All three SN have similar ?m 15,0.93,0.94and 1.13respectively.However,Candia et al.(2003)also note that the underluminous na-ture of SN 2000cx requires further con?rmation with a better distance estimate to the host NGC 524.
Multiband Optical Photometry of SN2004S7 https://www.wendangku.net/doc/ae16307829.html,parison of the properties of SN2004S with SN1992al.Decline rate,apparent magnitudes corrected for galactic extinction, Color and Absolute magnitudes at the time of B band maximum are compared for SN1992al and SN2004S.The numbers in parenthesis are the errors in the respective parameters.
1992al 1.11(0.05)14.60(0.07)14.65(0.06)14.94(0.06)-0.05(0.03)-19.47(0.32)-19.42(0.31)-19.13(0.31) 2004S 1.262(0.061)14.04(0.05)14.05(0.07)14.34(0.09)-0.01(0.08)-19.05(0.23)-18.96(0.18)-18.58(0.14)
SN M B?m15log L bol M Ni
(mag)(erg sec?1)M⊙
5COMPARISON WITH SN1992AL
As mentioned in section3the template of SN1992al?ts best with our data set.We therefore compare the observed and derived properties of these two supernovae in Table6. For SN1992al de-reddened and K-corrected apparent mag-nitudes,colour,decline rate and absolute magnitudes are taken from Hamuy et al.(1996a).The corresponding quan-tities for SN2004S are from this work.As we see from the table,the intrinsic properties of these two supernovae are very similar,although SN2004S may be marginally less lu-minous particularly in the I c band.The above comparison reinforces the general conclusion that for SNe Ia with sim-ilar light curves the intrinsic luminosities tend to be very similar.
6CONCLUSIONS
We report photometric observations of SN2004S which were carried out using the1-m Sampurnanand Telescope at ARIES,Nainital during2004February12to March22. UBVR c I c light curves have been studied by combining our data with data available in the literature.We estimate the peak magnitudes in di?erent bands and time of B maximum using the template?tting method.The light curve parameter?m15is estimated to be 1.26±0.061 from our data.The light curve template of SN1992al?ts quite well to SN2004S.We present the bolometric light curve which illustrates the decay of total luminosity of the supernova.The estimated peak luminosity8.715x1042 erg/sec yields a value of56Ni mass ejected to be0.41M⊙. Comparing the derived mass of ejected56Ni in di?erent SNe Ia including SN2004S we notice that for a given nickel mass,there could be a signi?cant dispersion in peak luminosity,as the envelope structure and hence the decline rate parameter?m15could be di?erent in di?erent cases. SN2004S can be placed as a mid-range decliner and the ejected mass of56Ni also has a mid-range value in this case.
7ACKNOWLEDGMENT
We wish to thank J.C.Pandey and S.B.Pandey for their help with the photometric data reduction.Illuminating dis-cussions with Abhijit Saha are gratefully acknowledged.One
of the authors(KM)also wishes to thank L.Resmi for sev-eral useful discussions.APK and KM acknowledge Dept.of Science and Technology,India for?nancial support.We are thankful to an anonymous referee for helpful comments and suggestions.
REFERENCES
Altavilla G.et al.,2004,MNRAS,349,1344-1352
Barbon R.,Ciatti F.,Rosino L.,1973,A&A,29,57
Barbon R.,Benetti S.,Cappellaro E.et al.,1990,A&A, 237,79
Biggs J.,2004,IAU Circ.8282
Branch D.,1981,ApJ,248,1076
Branch D.,1992,ApJ,392,35-40
Cardelli J.A.,Clayton G.C.,Mathis J.S.,1989,ApJ,345, 245
Candia P.et al.,2003,PASP,115,277
Contardo G.,Leibubdgut B.,Vacca W.D.,2000,A&A, 359,876-886
Cristiani S.et al.,1992,A&A,259,63
Elias J.H.,Frogel J.A.,Hackwell J.A.,Persson S.E., 1981,ApJ,251,L13-L16
Elias J.H.,Matthews K.,Neubebauer G.et al.,1985,ApJ, 296,379
Espinoza J.,2004,
https://www.wendangku.net/doc/ae16307829.html,/snweb2/2004/04S Meas.htm Filippenko A.V.et al.,1992a,ApJ,384,L15
Filippenko A.V.et al.,1992b,AJ,104,1543
Ford C.H.,Herbst W.,Richmond M.W.et al.,1993,AJ, 106,1101
Frogel J.A.,Gregory B.,Kawara K.et al.,1987,ApJ,315,
L129
Fukugita M.,Shimasaku K.,Ichikawa T.,1995,PASP,107, 945
Garnavich P.M.,Bonanos A.Z.,Krisciunas K.et al.,2004, ApJ,613,1120
Gibson B.K.&Stetson P.B.2001,ApJ,547,L106
Hamuy M.,Phillips M.M.,Suntze?N.B.et al.,1996a,AJ, 112,2398
8Kuntal Misra et al.
Hamuy M.,Phillips M.M.,Suntze?N.B.,&Schommer R.A.et al.,1996b,AJ,112,2438
Hernandez M.,Meikle W.P.S.,Aparicio A.et al.,2000, MNRAS,319,223-234
H¨o?ich P.,Khokhlov A.,Wheeler J.C.et al.,1996,ApJ, 472,L81-L84
Howell D.A.,H¨o?ich P.,Wang L.,&Wheeler J.C.,2001, ApJ,556,302
Hoyle F.,&Fowler W.A.,1960,ApJ,132,565
Je?ery D.J.,Leibundgut B.,Kirshner R.P.et al.,1992, ApJ,397,304
Krisciunas K.,Suntze?N.B.,Candia P.et al.,2003,AJ, 125,166
Krisciunas K.,2004a,
https://www.wendangku.net/doc/ae16307829.html,/snweb2/2004/04S Home.htm Krisciunas K.,2004b,
https://www.wendangku.net/doc/ae16307829.html,/snweb2/2004/04S Meas.htm Krisciunas K.,Suntze?N.B.,Phillips M.M.et al.,2004c, AJ,128,3034
Labbe et al.,2001,BAAS,33,1370
Lacruz J.,2004,
https://www.wendangku.net/doc/ae16307829.html,/snweb2/2004/04S Meas.htm Leibundgut B.,1988,Light curves of Supernovae Type I, PhD Thesis,University of Basel,Basel
Leibundgut B.et al.,1993,AJ,105,301
Leibundgut B.,2000,ARA&A,10,179-209
Li W.D.et al.,2001,PASP,113,1178-1204
Li W.D.et al.,2003,PASP,115,453
Lira P.et al.,1998,AJ,115,234
Martin R.,2004,IAU Circ.8282
Mazzali P.A.,Danziger I.J.,Turatto M.,1995,A&A,297, 509
Mazzali P.A.,Chugai N.,Turatto M.et al.,1997,MNRAS, 284,151
Meikle W.P.S.,2000,MNRAS,314,782
Nobili S.,Goobar A.,Knop R.,Nugent P.,2003,A&A,404, 901
Perlmutter S.et al.,1997,ApJ,483,565
Phillips M.M.,Phillips A.C.,Heathcore S.R.et al.,1987, PASP,99,592
Phillips M.M.,Wells L.A.,Suntze?N.B.et al.,1992,AJ, 103,1632
Phillips M.M.,1993,ApJ,413,L105
Phillips M.M.,Lira P.,Suntze?N.B.et al.,1999,AJ,118, 1766
Phillips M.M.et al.,2003,in From Twilight to Hight-light:The Physics of Supernovae,ed.W.Hillebrandth&
B.Liebundgut(Berlin:Springer),193
Pinto,P.A.,&Eastman,R.G.2000,ApJ,530,757 Pskovskii Y.P.,1970,AZh,47,994
Pskovskii Y.P.,1977,Soviet Astron.,21,675
Riess A.G.,Press W.H.,&Kirshner R.P.,1996,ApJ, 473,88-109
Riess A.G.et al.,1998,AJ,116,1009
Ruiz-Lapuente P.,Cappellaro E.,Turatto M.et al.,1992, ApJ,387,L33
Santallo R,2004,
https://www.wendangku.net/doc/ae16307829.html,/snweb2/2004/04S Meas.htm Schlegel D.J.,Finkbeiner D.P.,Davis M.,1998,ApJ,500, 525
Stritzinger M.,Hamuy M.,Suntze?N.B.et al.,2002,AJ, 124,2100Strolger L.-G.,Smith R.C.,Suntze?N.B.,Phillips M.M. et al.,2002,AJ,124,2905-2919
Suntze?L.J.,1996,in Supernova and Supernova Rem-nants,eds.R.McCray and Z.Wang,Cambridge Univer-siry Press,Cambridge,41
Suntze?N.B.2000,in AIP Conf.Proc.522,Cosmic Ex-plosions,ed.S.S.Holt&W.W.Zhang(New York:AIP), 65
Suntze?N.,Globus A.,Galli L.,Whiting,&Schmidtobre-ick,2004,IAU Circ.8383
Turatto M.,Benetti S.,Cappellaro E.et al.,1997,MNRAS, 283,1
比较PageRank算法和HITS算法的优缺点
题目:请比较PageRank算法和HITS算法的优缺点,除此之外,请再介绍2种用于搜索引擎检索结果的排序算法,并举例说明。 答: 1998年,Sergey Brin和Lawrence Page[1]提出了PageRank算法。该算法基于“从许多优质的网页链接过来的网页,必定还是优质网页”的回归关系,来判定网页的重要性。该算法认为从网页A导向网页B的链接可以看作是页面A对页面B的支持投票,根据这个投票数来判断页面的重要性。当然,不仅仅只看投票数,还要对投票的页面进行重要性分析,越是重要的页面所投票的评价也就越高。根据这样的分析,得到了高评价的重要页面会被给予较高的PageRank值,在检索结果内的名次也会提高。PageRank是基于对“使用复杂的算法而得到的链接构造”的分析,从而得出的各网页本身的特性。 HITS 算法是由康奈尔大学( Cornell University ) 的JonKleinberg 博士于1998 年首先提出。Kleinberg认为既然搜索是开始于用户的检索提问,那么每个页面的重要性也就依赖于用户的检索提问。他将用户检索提问分为如下三种:特指主题检索提问(specific queries,也称窄主题检索提问)、泛指主题检索提问(Broad-topic queries,也称宽主题检索提问)和相似网页检索提问(Similar-page queries)。HITS 算法专注于改善泛指主题检索的结果。 Kleinberg将网页(或网站)分为两类,即hubs和authorities,而且每个页面也有两个级别,即hubs(中心级别)和authorities(权威级别)。Authorities 是具有较高价值的网页,依赖于指向它的页面;hubs为指向较多authorities的网页,依赖于它指向的页面。HITS算法的目标就是通过迭代计算得到针对某个检索提问的排名最高的authority的网页。 通常HITS算法是作用在一定范围的,例如一个以程序开发为主题的网页,指向另一个以程序开发为主题的网页,则另一个网页的重要性就可能比较高,但是指向另一个购物类的网页则不一定。在限定范围之后根据网页的出度和入度建立一个矩阵,通过矩阵的迭代运算和定义收敛的阈值不断对两个向量authority 和hub值进行更新直至收敛。 从上面的分析可见,PageRank算法和HITS算法都是基于链接分析的搜索引擎排序算法,并且在算法中两者都利用了特征向量作为理论基础和收敛性依据。
pagerank算法实验报告
PageRank算法实验报告 一、算法介绍 PageRank是Google专有的算法,用于衡量特定网页相对于搜索引擎索引中的其他网页而言的重要程度。它由Larry Page 和Sergey Brin在20世纪90年代后期发明。PageRank实现了将链接价值概念作为排名因素。 PageRank的核心思想有2点: 1.如果一个网页被很多其他网页链接到的话说明这个网页比较重要,也就是pagerank值会相对较高; 2.如果一个pagerank值很高的网页链接到一个其他的网页,那么被链接到的网页的pagerank值会相应地因此而提高。 若页面表示有向图的顶点,有向边表示链接,w(i,j)=1表示页面i存在指向页面j的超链接,否则w(i,j)=0。如果页面A存在指向其他页面的超链接,就将A 的PageRank的份额平均地分给其所指向的所有页面,一次类推。虽然PageRank 会一直传递,但总的来说PageRank的计算是收敛的。 实际应用中可以采用幂法来计算PageRank,假如总共有m个页面,计算如公式所示: r=A*x 其中A=d*P+(1-d)*(e*e'/m) r表示当前迭代后的PageRank,它是一个m行的列向量,x是所有页面的PageRank初始值。 P由有向图的邻接矩阵变化而来,P'为邻接矩阵的每个元素除以每行元素之和得到。 e是m行的元素都为1的列向量。 二、算法代码实现
三、心得体会 在完成算法的过程中,我有以下几点体会: 1、在动手实现的过程中,先将算法的思想和思路理解清楚,对于后续动手实现 有很大帮助。 2、在实现之前,对于每步要做什么要有概念,然后对于不会实现的部分代码先 查找相应的用法,在进行整体编写。 3、在实现算法后,在寻找数据验证算法的过程中比较困难。作为初学者,对于 数据量大的数据的处理存在难度,但数据量的数据很难寻找,所以难以进行实例分析。
PageRank算法的核心思想
如何理解网页和网页之间的关系,特别是怎么从这些关系中提取网页中除文字以外的其他特性。这部分的一些核心算法曾是提高搜索引擎质量的重要推进力量。另外,我们这周要分享的算法也适用于其他能够把信息用结点与结点关系来表达的信息网络。 今天,我们先看一看用图来表达网页与网页之间的关系,并且计算网页重要性的经典算法:PageRank。 PageRank 的简要历史 时至今日,谢尔盖·布林(Sergey Brin)和拉里·佩奇(Larry Page)作为Google 这一雄厚科技帝国的创始人,已经耳熟能详。但在1995 年,他们两人还都是在斯坦福大学计算机系苦读的博士生。那个年代,互联网方兴未艾。雅虎作为信息时代的第一代巨人诞生了,布林和佩奇都希望能够创立属于自己的搜索引擎。1998 年夏天,两个人都暂时离开斯坦福大学的博士生项目,转而全职投入到Google 的研发工作中。他们把整个项目的一个总结发表在了1998 年的万维网国际会议上(WWW7,the seventh international conference on World Wide Web)(见参考文献[1])。这是PageRank 算法的第一次完整表述。 PageRank 一经提出就在学术界引起了很大反响,各类变形以及对PageRank 的各种解释和分析层出不穷。在这之后很长的一段时间里,PageRank 几乎成了网页链接分析的代名词。给你推荐一篇参考文献[2],作为进一步深入了解的阅读资料。
PageRank 的基本原理 我在这里先介绍一下PageRank 的最基本形式,这也是布林和佩奇最早发表PageRank 时的思路。 首先,我们来看一下每一个网页的周边结构。每一个网页都有一个“输出链接”(Outlink)的集合。这里,输出链接指的是从当前网页出发所指向的其他页面。比如,从页面A 有一个链接到页面B。那么B 就是A 的输出链接。根据这个定义,可以同样定义“输入链接”(Inlink),指的就是指向当前页面的其他页面。比如,页面C 指向页面A,那么C 就是A 的输入链接。 有了输入链接和输出链接的概念后,下面我们来定义一个页面的PageRank。我们假定每一个页面都有一个值,叫作PageRank,来衡量这个页面的重要程度。这个值是这么定义的,当前页面I 的PageRank 值,是I 的所有输入链接PageRank 值的加权和。 那么,权重是多少呢?对于I 的某一个输入链接J,假设其有N 个输出链接,那么这个权重就是N 分之一。也就是说,J 把自己的PageRank 的N 分之一分给I。从这个意义上来看,I 的PageRank,就是其所有输入链接把他们自身的PageRank 按照他们各自输出链接的比例分配给I。谁的输出链接多,谁分配的就少一些;反之,谁的输出链接少,谁分配的就多一些。这是一个非常形象直观的定义。