考研英语二 图表作文+范文++模板

考研英语图表作文范文
2010英语(2)大纲样题
48. Directions: In this section, you are asked to write an essay based on the following table, in
which you should 1) describe the table and 2) state your opinions drawn from it.
You should write at least 150 English words.
Accidents in a Chinese City (2005)
Main accident causes
Number of accidents
in 2005 Percentage rise (+) or fall
(-)
over 2004
1. drivers turning left without due
care
608 +10%
2. drivers traveling too close to
other vehicles
411 +9%
3. pedestrians crossing roads
carelessly
201 +12%
4. drivers driving under the
influence of alcohol
281 +15%
5. drivers failing to give a signal 264 -5%
高分作文
The above is a table showing the vehicle-related traffic accidents in the year 2005, as is contrasted with those of the corresponding classes or categories in the previous year. There are 5 classes of vehicle-related accidents in the table, divided in accordance with the causes of the accidents. Of all the 5 classes of accidents, 4 have gone up, and only one goes down slightly, showing a worsening situation.
Of the classes of accidents that have gone up, the largest in scale of increase (15%) comes in the accidents caused by drivers who have drunk alcohol. Under the influence of alcohol, drivers are liable to lose their control or even consciousness, thus causing disasters. The total banning of alcohol from the drivers who are about to drive is in nature an action to save lives. Unfortunately, over four hundred pedestrians have become victims of traffic accidents due to their own
carelessness. A conclusion can be easily drawn that strict observance of traffic laws and regulations, both drivers and pedestrians, is the precondition and a necessity of avoiding traffic accidents. Wheeled vehicles have been invented and produced as a help to human life, rather than a killer of human lives.
2011 (2)
Part B
48. Directions:
Write an essay based on the following chart. In your writing, you should:
1) interpret the chart and
2) give your comments.
You should write at least 150 words.
Write your essay on ANSWER SHEET2. (15points)
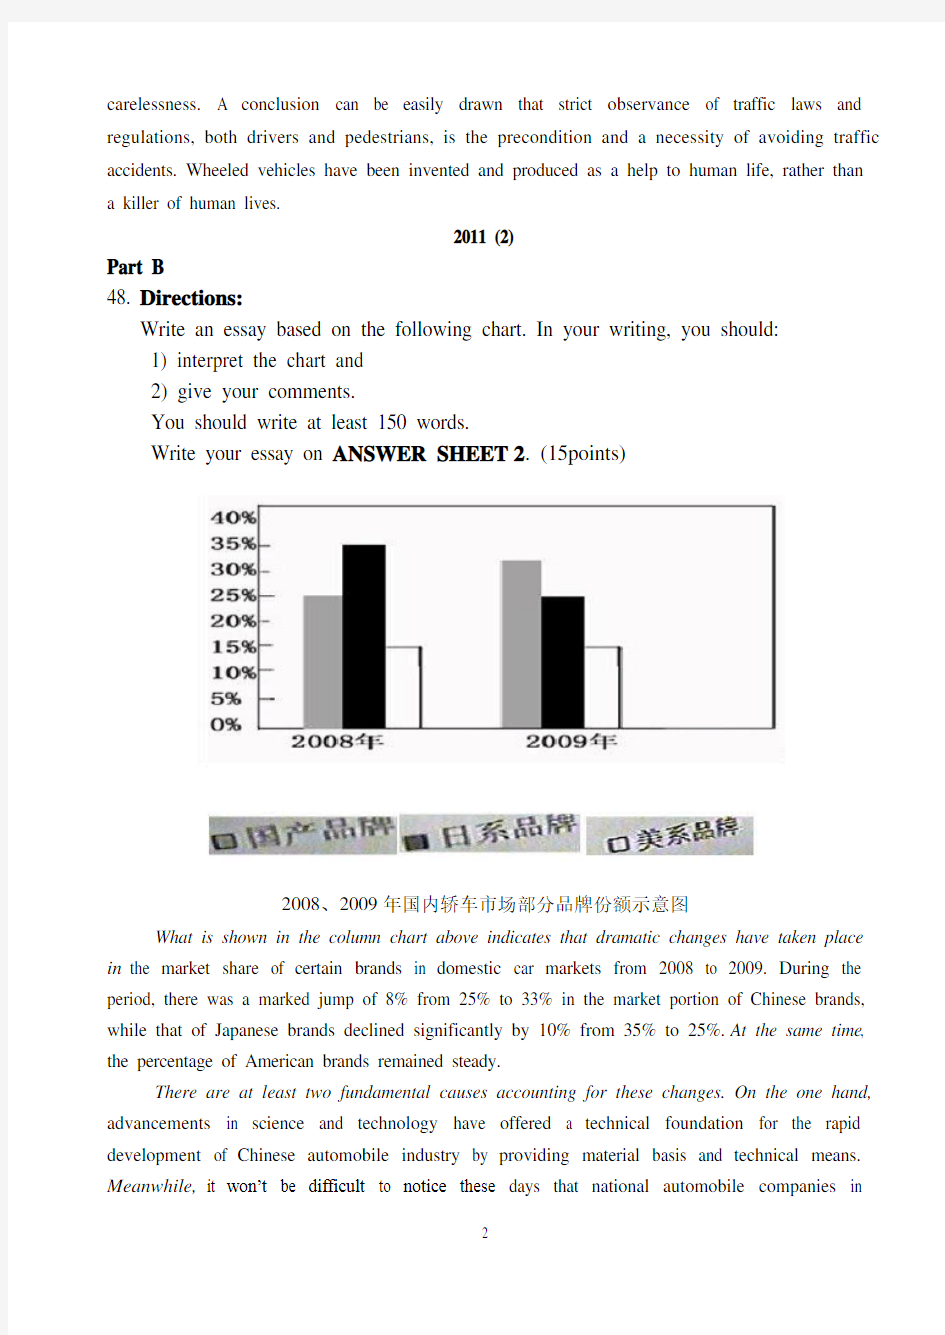
2008、2009年国内轿车市场部分品牌份额示意图
What is shown in the column chart above indicates that dramatic changes have taken place in the market share of certain brands in domestic car markets from 2008 to 2009. During the period, there was a marked jump of 8% from 25% to 33% in the market portion of Chinese brands, while that of Japanese brands declined significantly by 10% from 35% to 25%. At the same time, the percentage of American brands remained steady.
There are at least two fundamental causes accounting for these changes. On the one hand, advancements in science and technology have offered a technical foundation for the rapid development of Chinese automobile industry by providing material basis and technical means. Meanwhile,it won’t be difficult to notice these days that national automobile companies in
mounting numbers turn to price promotions to boost sales. On the other hand, the dishonest words and behaviors of Japanese automobile corporations such as Toyota in recent years cheapens their image and finally ruin their reputation.
To sum up, brands are insubstantial treasure. They are akin to a product’s or a company’s reputations. Obviously,if Chinese automobile industry wants to make continuous profits, what they need is to try promotions that reinforce Chin ese brands’ image.(新东方王江涛)
2010 (2)
48. Directions:
In this section, you are asked to write an essay based on the following chart. In your writing, you should
1) interpret the chart and
2) give your comments.
You should write at least 150 words.
Write your essay on ANSWER SHEET 2. (15 points)
As is shown in the chart, mobile phone subscriptions grow rapidly from 2000 to 2008. We can also find out that developing countries are the driving force for such a rapid growth. According to the chart, mobile-phone subscription number increased to 8 times from 2000 to 2008, that is from around 0.5 billion to 4 billion, while subscription number only increased twice from around 0.5 billion to 1 billion.
I think there are two main reasons for such a great contrast.
First of all, developing countries have much larger population than developed countries. For example, China and India nearly have half of the total population of the world. China has the most mobile-phone users right now, which increased greatly from 2000 to 2008. It is the same in India and other developing countries.
Secondly, developing countries have been enjoying strong economic growth in recent years. As a result, people in most developing countries are richer and richer, especially in China. So they can afford to buy such necessities, including mobile-phone, as the prices continued to drop greatly in the past years.
Thus, we can conclude that as economy grows strongly in developing countries, people in these countries can buy more products. (Total: 15; Score: 14)
1999
★From these graphs, we can draw a conclusion that, with the growth of human population, the number of species has decreased rapidly in America, and some species have been vanished from our planet.
Why does this phenomenon appear? I think there are several possible reasons for this. First, with a rapid growth of population, more and more people came to live where some wild species have been living. Then these species have to move to other places. Some of them probably cannot adapt to the new environment and die. Second, although many people look on the wildlife as their friends, some people may not think so. They catch a lot of wild animals and sell them in order to get more money. Third, with the development of the industry, the natural balance and the ecologic environment are destroyed. The deforestation has become more and more serious. So some of the wildlives become homeless and extinct.
In order to protect the wildlife, I have some suggestions. First, the governments should make laws to prevent them being caught and killed. Second, the governments should educate people to love the nature and protect it. Third, as for ourselves, we should take practical actions to protect our living environment. (Total: 15; Score: 14)
★As is shown by the two graphs, the U.S. population soared from 2 million to 250 million from 1800 to 1990. In contrast, the number of wildlife species no longer existing shot up, adding up to 70 over the same period of time. It is obvious that the extinction of wildlife resulted from the population explosion.
We may cite a variety of reasons for this situation. First of all, the destruction of ecological balance plays a pushing role. Due to population problem, pollution and desertification are becoming increasingly serious. Furthermore, a great number of species were killed for food, for
money and even for fun. Even worse, with the rapid growth of human population inhabitable areas were expanding so fast that few areas were for wild animals.
To sum up, it is imperative for us to take effective measures to protect wildlife. Firstly, the U.S. government should pour more investment into wildlife protection in a bid to create a better environment. Secondly, the birth rate in the U.S. must be put under control as the dramatically expanding population gives rise to serious environmental problems.
★As is shown by the two graphs, it is obvious that with the rapid growth of US population from 1800 to 1900, the number of its wildlife species no longer existing soared during the same period. Naturally, we can draw the conclusion that the sharp decline of wildlife species resulted from the population growth.
We may cite a variety of reasons from this situation. To begin with, as the population grows, people consume much more natural resources, which often leads to excessive hunting. Furthermore, with the increase of human activities, modern people take up more and more space, which has a great impact on other species. Finally, the problem of pollution becomes more and more serious with the development of modern industry. More and more animals have to adapt themselves to the decaying environment or move to a totally different place, but not all of them are fortunate enough to survive the changes.
Solving this problem calls for, above all, the government’s efforts to control population growth, to decrease industrial pollution and to enhance the laws to forbid wildlife hunting. Moreover, common citizens should be aware of this ecological crisis and take on the responsibility of wildlife protection. In a word, only when the government and the common people make joint efforts can we hope to find a satisfactory solution to this problem.
1997
As is shown in the bar chart, the total production f tobacco in the world shrank from 14.364 billion pounds in 1994 to 14.2 billion pounds in 1995. According to the figures given in the pie chart, tobacco consumers account for 20%of the world population. This causes great harm to us. Financially, it results in a yearly loss of 200 billion US dollars spent on cigarettes. Physically, about 3 billion people on the globe die from smoking related disease every year.
Faced with such a threat, people from all walks of life have tried various measures for a total tobacco ban. For one thing, health experts try hard to warn the public of the dangers involved. For another, the authorities passed laws to limit tobacco production and consumption, raise tobacco taxes and prohibit smoking in public places. More importantly, the public launch campaign to cut smoking.
On the basis of the analyses above, we can predict the future tendency confidently. With the
further growth in economy and more changes in life style, the tendency of tobacco consumption indicated in the table will definitely decrease in the years to come.
★We meet people everywhere: in the streets, on college campuses and in shops. There are 5.8 billion people in the world, and the smokers are about 1.1 billion, which makes up 20 percent of the world’s total population.
Smoking is very harmful. I think there are two main aspects to the damage. First, smoking consumes a great deal of money. As is shown in the pictorial graph, smoking wastes 200 billion dollars each year in the world. Second, smoking does harm to the health of smokers, and it is the main cause of lung cancer. About 3 million people die because of the relevant diseases derived from smoking every year.
Because more and more people are aware of the great harm of smoking to humans, the amount of tobacco consumption is on the decrease. From the following figures we can clearly see the tendency. The total amount of world tobacco production added up to 14.364 billion pounds in 1994, but it dropped to 4.2 billion pounds in 1995. At the same time, many countries call on people to give up smoking. So it is certain that the number of smoking is to decrease. (Total: 15; Score 14)
★As is shown in the bar chart,the total production of tobacco in the world shrank from 14.364 billion pounds in 1994 to 14.2 billion pounds in 1995. According to the figures given in the pie chart, tobacco consumers accounts for 20% of the world population. Financially, it results in a yearly loss of 200 billion US dollars spent on cigarettes. Physically, about 3 million people on the globe die from smoking-related diseases every year.
Fortunately, the world tobacco production witnessed a decrease in recent years. According to this change, I confidently believe that there will be less and less tobacco consumption in the future, generally for two reasons. On the one hand, being aware of the harm of smoking, more and more people join in the fight against it. They either try their best to give up smoking or advise others not to smoke any longer. On the other hand,many governments have attached more attention to this social hazard and take various measures to put an end to it. Therefore, I have every reason to believe that the fight against smoking will be won by human beings at last.
作文模板
模版1
As is shown in the pictures, with the development of modern science and technology, . In one picture, . The caption reads, . On the contrary, . We are informed that .
The purpose of the pictures is to show us that due attention has to be paid to . If we let this situation go as it is, we do not know
will be in the near future. By that time, will suffer a great destruction.
Therefore, it is imperative for us to take drastic measures. For one thing, we should appeal to the authorities to make strict laws to control . For another, we should enhance the awareness of people that is vital to us. Only in this way can we . Also I believe that we humans can overcome this difficulty, and we will have a brighter future.
模版2
The set of drawings above vividly depicts . As is shown in the first picture, . The caption reads, . In the second picture, . We are informed that .
We can deduce from the table that due attention has to be paid to . The fact indicates that .
In my opinion, it is imperative to take steps to reverse the disturbing trend illustrated in the pictures. One measure would be . But more importantly, . Although the drive to fight against it is a long-standing and tremendous one, our joint efforts will eventually pay off. I believe that a happy and bright future is awaiting us if we make every effort to .
模版3
What is shown in the table (chart/graph) above indicates/ shows that drastic changes have taken place in . The statistics of rise and fall seem to exist in isolation but closely related to one another.
With the rapid advances in the living standard of the Chinese people in recent years, it has become common for people in many walks of life to . As an example of , we should remember that .
To crack this hard nut, people have worked out many effective measures. To begin with, . In addition, . More importantly, . Only in this way can . 模版4
The cartoon describes a very common phenomenon in our society that .
Why does this phenomenon appear/ take place/ arise? I think/ I’m convinced that there are several possible reasons for this. The first is that . Another major reason is . And studies show that another primary cause is . There is no denying that .
Having considered both sides of the argument, I have come to the conclusion that the advantages of outweigh the disadvantages. On the one hand, . On the other hand, . From this we can conclude that .
模版5
Through the pictures the author tries to warn us of the serious problem of
.
The main reason for my tendency to A is that 就理由进行解释. For instance, . Another reason can be seen by every one is that 就理由进行解释. For example, . The argument I support in the first paragraph is also in a position of advantage because .
Taking into account the factors above, we can safely draw a conclusion that
. Although I agree that there may be a couple of advantages of B, I feel that the disadvantages are more obvious, such as . In a word, . So it is sagacious to support the statement that it is better to A. 模版6
The cartoon ridicules/ criticizes some producers and companies that often . The picture reveals various problems in .
Depending on personal experience, personality type and emotional concern, we find that some people hold the idea of . Meanwhile, others prefer to . From my point of view, it is more advisable to choose rather than . My arguments for this point are listed as follows.
When the factors are examined, its advantages and disadvantages weighted, and biased opinions cast away, it is not difficult to draw the conclusion that .
模版7
The pictures indicate that there have been significant changes in in the last years. It can be seen in the picture that .
There is no denying that is the indication of civilization,
progress and development; nevertheless, it causes the serious problem of . Scientists have warned that unless effective measures are taken, the problem of will eventually get out of hand. Actually, people are showing a real concern over the problem. For example, so as to prevent it from . Only in this way can we really solve the problem of caused by .
Indeed, the earth is our home and we have the duty to take care of it for ourselves and our descendants. In my opinion, we should work out concrete solutions to the problem of . For instance, . Only in this way can we really solve the problem of .
模版8
As is shown/ illustrated/ can be seen/ depicted/ described in the pictures, a number of . At the upper part of the picture there are some Chinese characters, which read “”.
We can deduce from this picture that the drawer is trying to attract our attention to the tragedy of , which is part of the threat to . He seems to be saying that . In my opinion, is a symbol of , including humans, and, like , we also will be left homeless if we allow the destruction of the environment to continue.
This simple picture is a wake-up call for the whole of the human race. If this vivid image of the grim future of our planet is not to become a reality, we must take positive steps right now to put an end to the plundering of the earth’s natural resources. It is clear that the drawer of the picture is urging us to start with a campaign to save , which is something all of us can join by urging our local authorities to take positive measures to protect .
模版9
As is shown in the picture/ table/ chart/ graph, .
As the saying goes, every rose has its thorn, and this issue is no exception. The majority of people would agree that . To judge this issue, we should look at three aspects.
From the analyses made above, we may come to the conclusion that . With the further growth in economy and more changes in life style, the tendency indicated in the table will continue in the better direction. Therefore, I’m convinced that will definitely decrease in the years to come.
考研英语二图表作文范文和核心词汇
考研英语二图表作文预测:全国出境游 Topic 3: The boom of overseas traveling industry From the bar chart given above, we can observe that the number of people traveling abroad experienced some changes during the past several years. From 1999 to 2000, the number of Chinese people traveling abroad increased rapidly from 7.5 million to 10 million, and then to 12.1 million in 2001. The bar chart reveals that people in mounting numbers are going to travel abroad. What exactly contribute to this phenomenon? Reasons can be listed as follows: for one thing, the authorities have issued some preferential policies to promote the development of the overseas tourism industry, which encourages a sudden emergence of travel agencies that can provide customers with convenient overseas tourism services. Additionally, with the improvement of financial status and purchasing power, a considerable number of Chinese people can afford the once-deemed-expensive traveling expenses. Last but not least, as there exists huge difference in cultures, customs and landscapes between China and overseas countries, quite a few people hold that overseas traveling is not only a perfect way to relax oneself, but also enrich their knowledge and expand their horizons. By observing the past trends, we may forecast that the growth tendency will continue. However,it is also a highly variable industry
考研英语作文范文八篇
一、网恋 Directions: Write an essay entitled On-line Love Affair, your essay should meet the requirements below: (1)its side-effect (2)your viewpoints You should write 160~200words neatly on ANSWER SHEET 2. 背诵范文: Although the popular belief is that internet increasingly plays an important role in our daily life, a current survey indicates that it has also brought some youngsters great disadvantages. They can do whatever they like, such matters as playing games, chatting. And some are even falling in love with chatters, which is called on-line love. Fresh notion as on-line love is, it sounds ridiculous when analyzed profoundly. What these young people fail to understand is that both sides have not well acquainted with mutually. Some net friends are reported to have been deceived by those people who are doing some criminal activities per year through the internet. Internet has indubitably provided various information for us, and on-line love is nothing but an artifact of fictitious world offered by internet. On the other hand, it is vital that we should make internet serve us better, and at the same time,as far as on-line love is concerned, being objective and levelheaded analysis is not far from being a sensible attitude. 范文精译: 尽管大家普遍认为网络在我们的日常生活中越来越重要,但当前的调查表明它同时也给一些年轻人带来了弊端。人们可以通过网络做他们喜欢做的一切,诸如打游戏、聊天。有些人甚至与聊天者谈起了恋爱,这就是所谓的网恋。 尽管网恋比较新颖,但仔细分析过后不免有些荒唐。这些年轻人没有意识到他们双方并不彼此了解。据报道,每年都有网友被那些专门通过网络做非法勾当的人欺骗。 毋庸置疑,网络给我们提供了各种各样的信息,而网恋只不过是网络这个虚幻世界的产物。一方面,我们应该使网络更好地为我们服务;同时就网恋而言,客观对待、冷静分析才是明智之举。 二、论美女经济 Directions: Write an essay with the title of On“Beauty Economy”,and your essay should be based on the following outline : (1)describe briefly the phenomenon of “beauty economy” (2)list positive effect (3)list negative effect You should write 160~200 words neatly on ANSWER SHEET 2. 背诵范文: The “beauty economy” actually is “the eyeball economy”. The beauties are used to attract the public attention and make a profit. Meanwhile, the beauty contest activity which we are familiar with is regarded as the most gigantic manifestation of beauty economy. In the supporter’s eyes, the beauty economy gains high business profits through plans, organization, propaganda of the beauty contest. The participants can have the qualifications to participate in the competition as honour. The winners make their social status reach a high position. Thereupon, people become enthusiastic about beauty economy. The merchant has been laughing uproariously which hawked. The beautiful woman has the stage which declares a position. However, others don’t agree with it. Firstly, the beauties are treated as “unliving objects” just like the flower vase, and people pay too much attention to the pretty appearance of the beauties, but their internal world is ignored. Secondly, it leads to the distorted beauty culture. Many girls even women worship blindly the beauties and spend a lot of money in face-lifting to emulate them. Then our traditional aesthetic conceptions are totally overturned, and our conventional virtues completely disappear. Last but not the least, the beauty economy misleads the values. Relying on“being beautiful”, pursuing the wealth, they go after like ducks. And it also causes them to be the money worship.
图表类英语作文范文英语作文模板(图表类的)
图表类英语作文范文英语作文模板(图表类的)这里很全 一、图表类作文常用的单词、短语和句型 1.表示数据变化的单词或短语 in the case of (在……的情况下) in terms of (在……方面) increase / raise / rise / go up(增加) decrease / grow down / drop / fall (减少) increased by (增长了) increased to (增长到) the number sharply goes up to(数字急剧上升至)
significant(重大的),steady(平稳的),gradual(逐渐的),slow(慢慢的),stable(稳定的),rapid(快速的)…… 2. 表示从图表得知的信息的句型 The table / chart / graph shows that...(这个图表告诉我们……) Aording to the table / chart /graph, we can see that...(根据图表,我们可以看出……) It can be concluded from the graph that...(从图表中可以得出……) The table shows the changes in the number of...over the period from...to...(该表格描述了在……期间……数量的变化) 二、图表类作文的模式
图表类作文中的图表主要有以下形式:柱形图类(chart)、圆饼图类(pie chart)、曲线图类(line chart)、表格类(table)。写文章时,首先要对图表加以描述,而后引出主题加以讨论,最后得出结论,也就是按照描述图表—解释原因—下结论的步骤来写。切忌对图表不作交代就直接谈论主题。 1.表格类作文的模式 表格类作文一般可以分为三段:第一段对表格中的数据进行描述,只要抓住变化规律即可,切忌一一列举数据;第二段说明变化的原因;第三段得出结论。即: (1) Studying the table carefully, we can see...(仔细研读表格,我们可以看出……) (2) In my opinion, the reasons why...are as follows. Firstly...Secondly...Thirdly...(在我看来,为什么……的原因在于以下几点:第一……第二……第三……)
2013年英语二作文模板
2013年英语二作文模板
1. 鉴于有许多后面报班的学员没有上过写作课,作文不知道如何下手,所以我还是给大家提供一些模板,但请大家务必一定灵活使用。自己已经整理出模板的同学尽量不要换模板了,免得考场遗忘。 为了大家方面背诵,建议顺序词(一二三)大家每次都用自己熟悉那个。 大家在背诵模板时一定要将作文的结构了然于心,哪一部分该写什么要清楚。今年大作文还是主要关注图表类作文。英语(一)近十多年一直考图画作文,英语(二)应该考图表作文。 2. 小作文今年主要关注以下四种书信:道歉信,询问信,求职信,申请信(继续深造)后面提供了范文。 3. 一点备考意见: 剩最后20天左右,请同学们不要急躁,急躁对考试毫无益处,只会浪费时间。强迫自己学习,做题,审查反省题目。下面就英语这块我给出几点备考意见以供参考: 1)请大家把这10套模拟题认真做完,每一篇作文都要亲自动手写,作文是写出来的。平时多练手,考试时才能有东西可写。模拟题对完答案后要仔细看一下自己是怎么错的。 2)回头把近三年的真题找出来重新做一遍,熟悉里面的每一个单词和短语,因为单词和短语重现频率很高。同时大家重点关注阅读理解错误选项是如何设置陷阱的,自己又是如何掉入陷阱的,避免重蹈覆辙。 3)即使在临考前最后一天大家也要看英语,甚至是找点题目来做,让自己保持预感,并处于做题状态。 4)大家在考试时翻译和写作一定要保持卷面干净整洁,并且每题要答在对应的位置,不可超出答题区,这样会扫描不上的。 5)下面给大家提供几个话题练练手:作文以不变应万变,好好练习即可。A.Credit Cards. You should write at least 150 words and base your composition on the outline (given in Chinese) below: 1. 越来越多的人使用信用卡。 2. 信用卡的优点及信用卡的弊端。 3.我的看法。 B.Should the University Campus Be Used as Public Lots? You should write at least 150 words and base your composition on the outline (given
2012年考研英语二小作文题目和范文
suppose your cousin LI MING has just been admited to a university write him/her a letter to:(1)Congratulate him/her,and(2)give him/her suggestions on how to get prepared for university life you should write about 100 words on ANSWER SHEET 2. DO not sign your own name at the end of the letter,Use "zhangwe 考研教育网考研英语二小作文范文: Dear friend, I am writing to congratulate you on your being successfully admitted to Harvard University,which enjoys an international reputation for its academic excellence and give you some suggestions as to how to make preparation for the coming college life. In order for you to adapt yourself to the university life,you are advised to get prepared physically and intellectually. First and foremost,you need to build a strong body for the future academic pursuit,so you can take some exercises during the breaks. Secondly,since the study in university is more demanding than in your secondary school,you are highly suggested to find some introductory books from the library so as to have a good idea of the specialty you are going to take in your college life. Given your sound ability,you are sure to have a successful college life. Congratulate you again and wish you a fruitful college life. Sincerely yours, Zhang Wei
考研英语历年图表作文范文
考研英语历年图表作文范文 图表作文是英语二大作文的考察形式,由一张图表和两段提纲构成,图表又分为4种类型来考察,包括柱形图,饼图,曲线图和表格。当然,同学在复习时,无需每种图表都各自准备,我们可以寻找图表中存在的共性,出万能的表达,化繁为简。以下就是图表作文的谋篇要点和万能表达。 首段为图表阐释段,也就是用文字描述图表中的相关数据。在本段中包括四大信息要点,图表标题,整体表现,极值和过渡句。在本段中将图表归为两类,动态图和静态图,在此同学们不必太过纠结,只需注意图表中反映的内容有无时间跨度,存在时间的变化为动态图,没有时间上的跨度称为静态图。 动态图和静态图在图表标题和过渡句上表达是一致的。首先图表标题是汉译英,具体的方法我们会在强化课程上讲解。在整体表现上,主要体现的是全部指数的变化或差异。动态图的表达为“As is clearly reflected by the chart, 全部指数witnessed some changes from 时间 to 时间.”静态图为As is clearly reflected by the chart, 全部指数show totally different attitudes towards 话题。
到了极值描述,就是反映出数据的最大变化和差异,它们都是趋势,所以,可以用这样的表达, Especially, 某指数 shows the most obvious tendency that 具体表现.在具体表现的描述中一定要包含具体数字,最后过渡句的通用句式是Obviously, the inclinations, clearly reflected by the chart, should be given more consideration. 中段为分析论证段,主要是从原因或者影响方面找切入点分析这种现象。 在这里只说原因方面,影响的切入点会在强化课程中具体介绍。段落包含两大要点-中心句和具体原因。中心句的作用就是承上启下,也就是承接上文提出的问题,开启下文阐释的原因。大家看看以下表达,Theoretically, several reasons may trigger the trend that 最大变化/差异, but the following two, for my part, could aount for the prevalence of the phenomenon mentioned above.接下来就是具体原因的介绍了,不建议同学们套用小作文中的分条写模板,第一字数太少,第二语言不够优秀。 “To begin with, it is universally admitted that +原因一. So long as you regard this analysis reasonable, I may go further. Another special consideration in this case is that+原因二.”这样的表达不仅吸睛,同学们自己需要写的内容也不多,避免了字数不够的尴尬。第三段为总结预测段,就是总结上
英语作文模板图表作文
图表分析作文1 As is clearly shown in the table/ figure/ graph / chart, 图表总体描述between 年代and 年代. Especially, 突出的数据变化. There are three reasons for 具体表示急剧上升、下降或特殊现象的词. To begin with, 原因一. In addition / Moreover, 原因二. For example, 具体例证. Last but no least, 原因三. In short,总结上文. As far as I am concerned, / For my part, / As for me,作者自己的观点. On the one hand, 理由一. On the other hand, 理由二. In brief,总结上文. 图表分析作文2 The table / figure / graph / chart shows that 图表总述from 年代to年代. It is self-evident that 突出的数据变化. Three possible reasons contribute to 具体表示急剧上升、下降或特殊现象的词或代词代替上文内容. One reason is that原因一. Another reason is that原因二. For instance,举例证. What’s more原因三. As a result, 重述上文之趋势. However, in my opinion 作者观点. For one thing,理由一. For another, 理由二. To sum up,总结上文. 图表分析作文3 It can be seen from the table / figure / graph / chart that图表总述between年代and年代. Especially,突出的数据变化. Why are there such great changes during 图表涉及的年头数years? There are mainly two reasons explaining具体表示急剧上升、下降或特殊现象的词或代词代替上文内容. First,原因一. In the old days,比较法说明过去的情况. But now,说明现在的情况. Second,原因二. As a result,总结上文. In my viewpoint,作者自己的观点. On the one hand,论点一. On the other hand,论点二. 图表分析作文4 As the table / figure / graph / chart shows,图表总述in the past years年代. Obviously,突出的数据变化. Why are there such sharp contrasts during 图表涉及的年头years? Two main factors contribute to具体表示急剧上升、下降或特殊现象的词或代词代替上文内容. First of all,原因一. In the past,比较法说明过去的情况. But now 说明现在的情况. Moreover,原因二. Therefore,总结上文. As I see it,作者自己的观点. For one thing,论点一. For another,论点二. 图表作文补充句型 ?As is shown in the graph… 如图所示… ?The graph shows that… 图表显示… ?As can be seen from the table,… 从表格中可以看出… ?From the chart, we know that… 从这张表中,我们可知… ?All these data clearly prove the fact that… 所有这些数据明显证明这一事实,即… ?The increase of …. In the city has reached to 20%. ….在这个城市的增长已达到20%. ?In 1985, the number remained the same. 1985年,这个数字保持不变. ?There was a gradual decline in 1989. 1989年,出现了逐渐下降的情况.
考研英语二大作文模板word精品
. 大作文写作步骤:看标题,找主语(数量,比例)1. )number, amount(money, time数量:] 不可数[可数] [ percentage, proportion, share 比例:轴看X-Y2. 反常找规律-3. 解释(分析数据)interpret①评论comments② 重要表达方式: 1.图表类型 graph图标, table表格, bar chart柱状图, pie chart饼状图 2.图标指向 The graph illustrates…图表说明... The bar chart shows data for…条形图显示的数据... It can be clearly seen from the pie chart that…从饼图可以清楚地看到... 3.时间段 over the past 5 years 在过去5年 over this span of 28 years 在这28年的跨度 during the period from March to May 在3月至5月期间 throughout the period 整个期间 for the rest of the period 在剩余的时间 4.动词 percentage百分比, number数量 (amount) experience huge fall 经历巨大的衰落 巨大的:vast, massive, enormous, immense, tremendous something unexpected 意外 occurred…发生… There be…会有… Japan experienced a massive increase in car ownership in the 1930s '日本在20世纪30年代经历了汽车拥有量的大幅增长 5.变化趋势 1)增加/上升/提高 rise gradually(rose)逐渐上升 climb rapidly(climbed)迅速爬升 . . go up significantly(went up)显着上升 rise slightly 略有上升 The number experienced slight rise. 数字略有上升。 experience dramatic increase 经验显着增加
考研英语作文范文和模板:图表作文
考研英语作文范文和模板:图表作文 图表作文 1.写作攻略图表作文是考研英语写作中较为常见的题型之一,也是难度较大的一种写作题型。这类作文可综合提供题目、数据、图像、提纲,形式多样,但实际上只涉及5个方面:描述图表、指明寓意、分析原因、联系实际、给出建议,而每次考试只是从这5个方面的内容中选出3个结合在一起。从写作类型来看,基本上属于说明文。要求考生围绕题目将有关信息转化为文字形式,考生应该具有一定数据分析和材料归纳的能力,同时会运用一定的写作方法。考研试题一般以三段式写作方法来组织文章,第一段总结归纳信息反映的整体情况,点出主题思想,第二段回答第一段所得出的问题,对数字、数据等做出有条理的分析比较,第三段做出总结或给以简单的评论。表格和图表题型写作要点:(1)考生应仔细研究题目以及提示信息,认清图表中的数字、线条、阴影等部分的变化趋势和走向,抓住其主要特点,然后根据图表所显示的中心信息确定内容层次以及主题句。(2)考生应该仔细研究图表所给出的大量信息,从中选取最重要,最有代表性的信息,然后根据全文的主旨去组织运用所获取的关键信息。切忌简单
地罗列图表所给出的信息。(3)图表作文一般采用的时态为一般现在时,但如果图表中给出了具体时间参照,考生则应对时态进行相应的调整。(4)图表作文有一些固定句型和表达法,考生应对此融会贯通。(5)图表作文可以细分为表格,曲线图、柱形图和饼形图。除了上述共同要点,考生还应了解这四种图在写作方面的不同特点。——表格可以表示多种事物的相互关系,所以考生要对表格中所给出的大量数字进行比较分析,从中找出其变化规律。——曲线图常表示事物的变化趋势,考生应认真观察坐标系所显示的数据信息,并且密切注意交汇在坐标横轴和纵轴上的数字及单位。——柱形图用来表示各种事物的变化情况及相互关系,要求考生通过宽度相等的柱形的高度或长度差别来判断事物的动态发展趋势,因此考生应密切关注坐标线上的刻度单位及图表旁边的提示说明与文字。——饼形图表示各事物在总体中所占的比例及相互关系,旨在要求考生准确理解并阐述一个被分割成大小不等切片的饼形图所传达的信息。考生应清楚掌握部分与整体,部分与部分之间的相互关系,这种关系通常是以百分比的数字形式给出的。(6)列出各段主题句。考生可以根据所给提纲或已知信息列出每段的主题句,为全文的展开做好铺垫。(7)围绕主题句完成段落的展开。尽量做到主题明确、条理清楚、文字简练。(8)检查与修改。对图
高三英语图表类作文
图表及漫画类作文 一写作模板 (1) 组图写作模板 The story took place 时间和地点. 事件起因(要点一,图片一的内容). 事件的发展(要点二、三……,图片二、三……的内容). 事件结局(最后一个要点,最后一张图片的内容) From the story, I feel自己的看法或感想. (2)对比图写作模板 Great changes have taken place in地点since时间. In the past, 描述过去的情景(图片一的内容). But now our village/school/city is taking on a new look. 描述现在的情景(图片二的内容). There are many reasons for the great changes. First, 变化的第一个理由. Second, 变化的第二个理由. Third, 变化的第三个理由…Last but not least, 变化的最后一个理由. I think自己的感想. (3)单张图写作模板 As can be seen in the picture, 图画内容. The picture tells us概括图片大意. The implied meaning of this picture should be taken into consideration seriously. To begin with, 揭示涵义/原因/结果1. Second, 揭示涵义/原因/结果2. In my opinion/ As for me, we should take some measures to deal with the problem. First , we should具体措施1. Second, we must具体措施2. Only in this way can we solve the problem of 图画内容. (4)图表作文模板 As is shown/ indicated/ illustrated by the figure/ percentage in the table/ graph/ chart/ pie, _____________ (作文题目的议题)has been on rise/ decline, significantly/ dramatically/steadily rising/ decreasing from ________ to _______. From the sharp/ marked decline/rise in the chart, it goes without saying that ____________________. There are at least two reasons accounting for _______________. On the one hand, ______________. On the other hand, ___________ is due to the fact that ______________. In
2017考研英语二作文模板
英语二 图表作文(一) 第二节图表作文的出题形式 例1题目:Changes in People’s Diet Study the following table carefully and your composition must be based on the information given in the table.Write three paragraphs to: 1.state the changes in people’s diet(饮食)in the past five years; 2.give possible reasons for the changes; 3.draw your own conclusions. You should quote as few figures as possible. 例2题目:Car Accidents Declining in Walton City Remember that your composition must be written according to the following outline;1.Rise and fall of the rate of car accidents as indicated by the graph;2.Possible reason(s)for the decline of car accidents in the city;3.Your predictions of what will happen this year. Your composition should be no less than 120words and you should quote as few figures as possible. 例3For this part ,you are allowed 30minutes to write a composition on the topic Health Gain in Developing Countries.Your composition must be no less than 120words and you should base your composition on the following instructions(given in Chinese): 1.以下图为依据描述发展中国家的期望寿命(life expectancy)和婴儿死亡率(infant mortality)的变化情况 2.说明引起变化的各种原因 从以上例子可见,图表作文一般在题目中给出作文的标题和一个或几个统计表格、圆形图、曲线图或条形图,有时还用英文或中文提纲的形式给出提示,要求我们:1)用文字描述图表,客观解释图表中所传递的信息,并找出某种规律或趋势; 2)就图表中所反映的某种趋势或问题分析其原因或后果。第三节图表作文的写作要领 图表作文着重说明事实,常常是通过对图表中所反映的具体数据的说明、分析、比较,对某种事物或现象的事实或变化情况等加以说明,并提出结论或看法。因此,图表作文常常采用议论文体的写作方法。 写好图表作文,关键在于能否读懂图表中所提供的信息,把握各信息间的联系,用准确流畅的语言把这一信息表达出来,并就这一信息发表自己的看法。图表作文的写作步骤 写图表作文时,要注意遵循以下步骤: 1)认真分析图表的含义,弄清图表中所含的信息及不同信息间的关系; 2)确定文章的主题思想,构思出文章的基本框架,筛选出能说明图表主题思想的典型数据;3)编列文章的提纲; 4)根据文章的提纲,将各段的提纲内容扩展成段落,然后将各个段落组成文章,注意段与段之间的衔接与过渡;5)检查与修改。 图表作文的篇章结构 20 17教 育硕 士 总群 1 90 776344
2019考研英语二小作文话题预测范文指导【六篇】
2019考研英语二小作文话题预测及范文指导【六篇】 一、信函写作:称呼、正文、落款 1、审题—-判断是个人书信&事务公函 决定: 语域使用:正式:使用礼貌表达,不用缩略语(对公) 半正式:能够使用缩略和口语表达(对私) 非正式:(一般不考)——It depends 呼语:特定的写信对象:Dear XX 不明确收信人:Dear Sir/Madam, or To Whom It May Concern 2、正文 三段(8句):写作目的段、细化段、感谢或者期待。 3、各种信函内容安排 A.基本结构 Dear…, 发出邀请; 为何邀请细节; 期望参加。 Yours sincerely, Li Ming B.常用句型
We are having a farewell party/a gather together/meeting/senar in (place) on (date) at (time). Would you like to come? (不太正式) It is my honor to inform you that there is an academic meeting in (place) on (date) at (time). We would be too glad to invite you as… (正式) I very much hope that you will accept the invitation. And I am looking forward to hearing back from you. C.下面以一封邀请看电影的短信为例: Dear Jane, We have four tickets for a famous film shown at Guangming Cinema, The Longest Day, Friday, the ninth. Will you join us? We’ll be looking for you at eight sharp Friday night in front of the cinema, so don’t disappoint us! Warmest regards. Alice 【必备表达】 1、邀请目的 On behalf of…, I have the honor to invite you to… It is with the great pleasure that I write to cordially invite you to… It gives me the greatest pleasure to invite you to… We should be very grateful if you could… 2、活动安排
图表类英语作文范文
图表类英语作文范文 图表类型的英语写作如果不擅于观察漫画的话,作文写出来可能会偏题。下面是小编给大家带来图表类英语作文,供大家参阅! 图表类英语作文范文篇1第一段:说明图表 开篇句:As the bar chart shows, ____ during the years of ____to____. 扩展句:1、As early as _____. 2、Then _____ years later, ____. 3、And arriving in the year ____, ____. 第二段:解释图表变化原因 主题句:Several factors contribute to _____. 扩展句:1、______. (原因1) 2、And ______.(原因2) 3、Furthermore, ______ (原因3) 4、All these result in ____. 第三段:提出解决办法 结尾句:However, ____ is faced with some problems. 扩展句:1、With _____, ____, the effect of which is not only discouraging, but also challenging. 2、So my principle is to pay due attention to ___, but not
justto____. 示范 第一段:说明图表 开篇句:As the bar chart shows, the number of people below the poverty line decreased dramatically during the years of 1978 to1997. 扩展句:1、As early as 1978, about 250 million people were under the poverty line. 2、Then seven years later, the number became three fifths thatof1978. 3、And arriving in the year 1997, the number was reduced to50millions. 第二段:解释图表变化原因 主题句:Several factors contribute to the sharp decrease of the below-poverty population. 扩展句:1、The reform and opening following 1978 enabled the peasants to become much better off. (原因1) 2、And with the development of Chinese economy, that policy also improved city dwellers lives greatly. (原因2) 3、Furthermore, the high-tech introduced made it possible for the countrys economy as a whole to take off. (原因3) 4、All these result in the great fall of the