AP0164 Power Monitoring on the Desktop NanoBoard NB2DSK01
Power Monitoring on the Desktop NanoBoard NB2DSK01
Summary
Application Note
AP0164 (v1.0) May 20, 2008 This application note provides information on the Power Monitoring functionality provided for the Desktop NanoBoard NB2DSK01. It covers how this functionality is supported in the hardware and how to access the monitoring features from within Altium Designer.
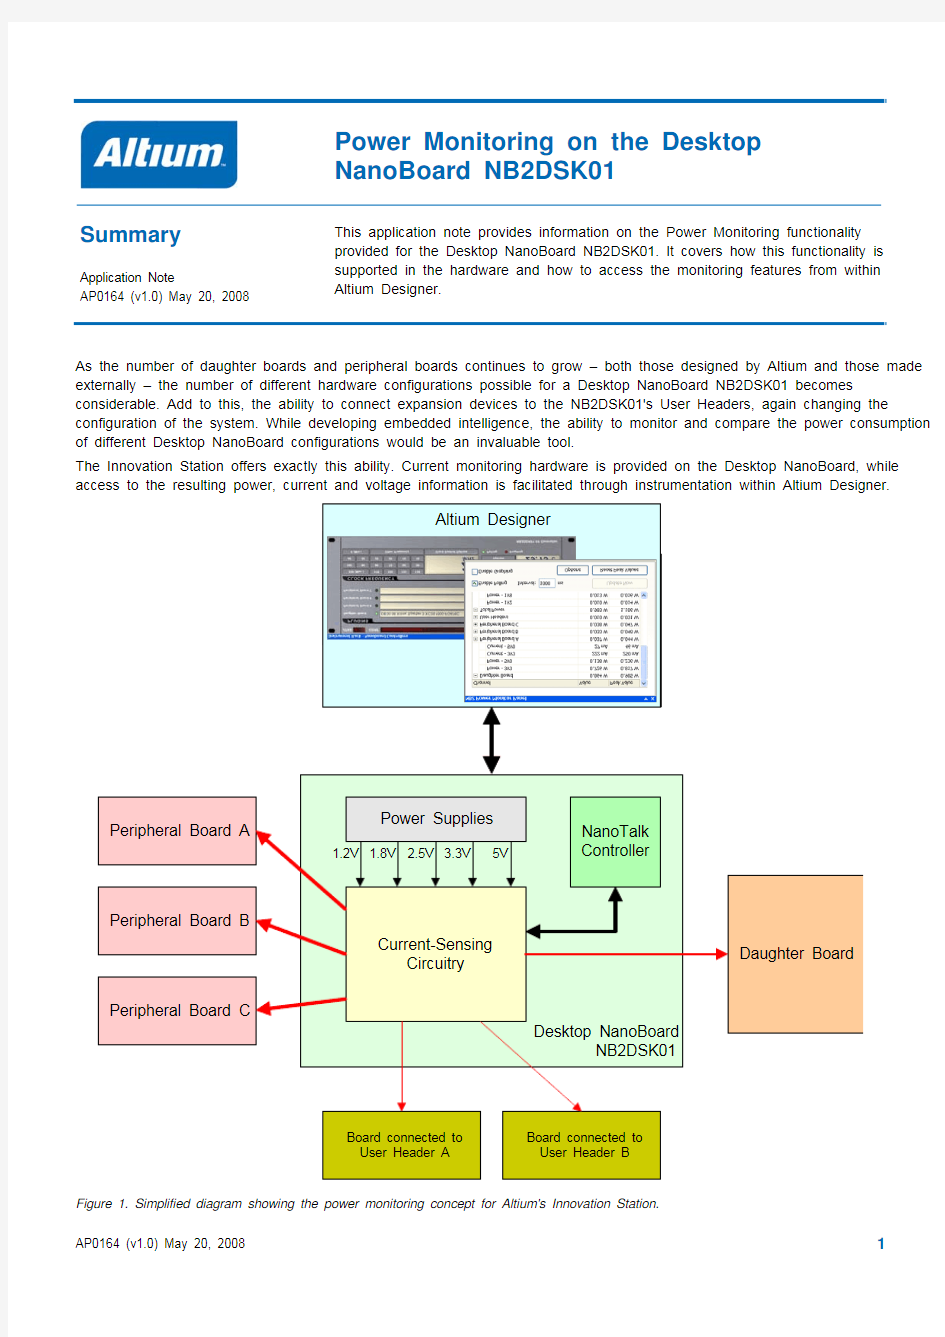
As the number of daughter boards and peripheral boards continues to grow – both those designed by Altium and those made externally – the number of different hardware configurations possible for a Desktop NanoBoard NB2DSK01 becomes considerable. Add to this, the ability to connect expansion devices to the NB2DSK01's User Headers, again changing the configuration of the system. While developing embedded intelligence, the ability to monitor and compare the power consumption of different Desktop NanoBoard configurations would be an invaluable tool.
The Innovation Station offers exactly this ability. Current monitoring hardware is provided on the Desktop NanoBoard, while access to the resulting power, current and voltage information is facilitated through instrumentation within Altium Designer.
Figure 1. Simplified diagram showing the power monitoring concept for Altium's Innovation Station.
Power Monitoring on the Desktop NanoBoard NB2DSK01 Functionality at the Hardware-Level
Before looking at how the power monitoring functionality is accessed within the software, it is worth taking a look at the underlying hardware, by which such power monitoring of the system is made possible.
On the NB2DSK01 motherboard, current monitoring is in place for each of the following power lines:
? 1.2V, 1.8V, 2.5V, 3.3V and 5V lines routed to the 'PERIPHERAL BOARD A' connector
? 1.2V, 1.8V, 2.5V, 3.3V and 5V lines routed to the 'PERIPHERAL BOARD B' connector
? 1.2V, 1.8V, 2.5V, 3.3V and 5V lines routed to the 'PERIPHERAL BOARD C' connector
? 3.3V and 5V lines routed to the corresponding connectors for the daughter board
? 3.3V or 5V line selected for use with 'User Header A' connector
? 3.3V or 5V line selected for use with 'User Header B' connector.
A total of 19 monitored power lines.
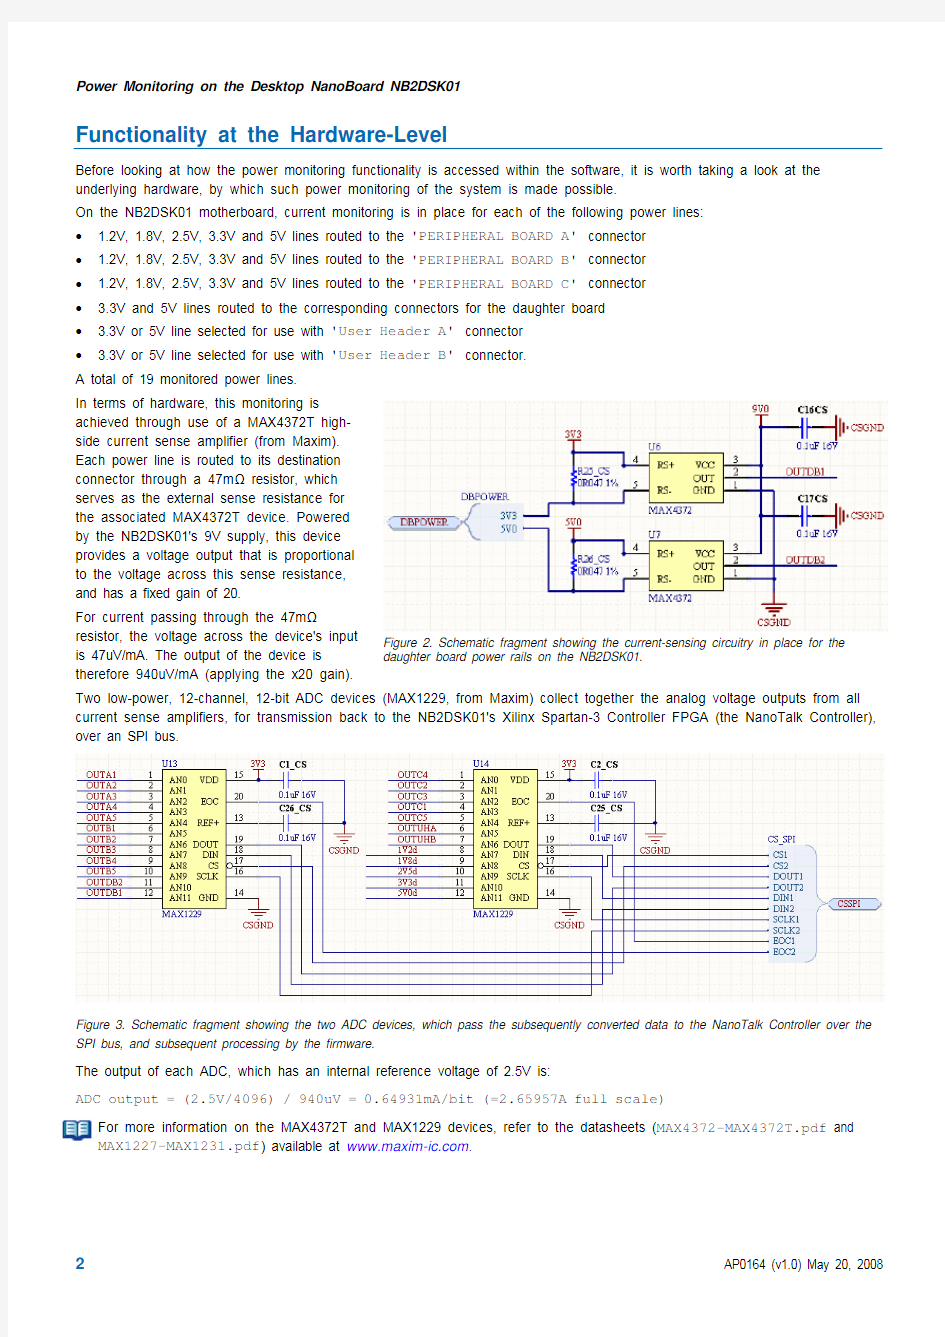
In terms of hardware, this monitoring is
achieved through use of a MAX4372T high-
side current sense amplifier (from Maxim).
Each power line is routed to its destination
connector through a 47m ? resistor, which
serves as the external sense resistance for
the associated MAX4372T device. Powered
by the NB2DSK01's 9V supply, this device
provides a voltage output that is proportional
to the voltage across this sense resistance,
and has a fixed gain of 20.
Figure 2. Schematic fragment showing the current-sensing circuitry in place for the daughter board power rails on the NB2DSK01.
For current passing through the 47m ?
resistor, the voltage across the device's input
is 47uV/mA. The output of the device is
therefore 940uV/mA (applying the x20 gain). Two low-power, 12-channel, 12-bit ADC devices (MAX1229, from Maxim) collect together the analog voltage outputs from all current sense amplifiers, for transmission back to the NB2DSK01's Xilinx Spartan-3 Controller FPGA (the NanoTalk Controller),
over an SPI bus.
Figure 3. Schematic fragment showing the two ADC devices, which pass the subsequently converted data to the NanoTalk Controller over the SPI bus, and subsequent processing by the firmware.
The output of each ADC, which has an internal reference voltage of 2.5V is:
ADC output = (2.5V/4096) / 940uV = 0.64931mA/bit (=2.65957A full scale)
For more information on the MAX4372T and MAX1229 devices, refer to the datasheets (MAX4372-MAX4372T.pdf and MAX1227-MAX1231.pdf ) available at https://www.wendangku.net/doc/cb596538.html,
.
Power Monitoring on the Desktop NanoBoard NB2DSK01 Accessing and Using Power Monitoring
Prior to accessing the power monitoring in Altium Designer, ensure that the Desktop NanoBoard is connected to the PC (via USB or Parallel connection) and is powered-on.
'Command Central' for power monitoring can be found on the instrument panel for the NanoBoard. Simply double-click on the icon for the NB2DSK01 in the Devices view (View ? Devices View ) to access the Instrument Rack – NanoBoard Controllers
panel (Figure 4).
Figure 4. Power monitoring is an integral part of the Desktop NanoBoard's instrument panel.
The controls are located in the bottom-right region of the panel,
labeled 'POWER MONITOR'. Use the Polling LED to essentially
turn power monitoring ON or OFF with respect to the panel.
Figure 5. Use the Power Monitor panel to get a detailed view of the currents drawn and the power used across all monitored
lines.
With polling enabled, the window to the right presents the total
power usage across all 19 monitored power rails on the
NB2DSK01, as well as its temperature (in Degrees Celsius).
Fo each satellite board (daughter board and peripheral boards)
currently plugged into the NB2DSK01 motherboard (and presented
in the 'PLUGINS' region of the panel), the total power usage
across all monitored power rails (routed to the corresponding
docking connector) is shown.
For a more detailed look at the power monitoring landscape, click
on the Show Panel button to access the Power Monitor panel
(Figure 5).
Note: The panel can be accessed directly from the Devices view
by right-clicking on the icon for the NB2DSK01 and choosing Show
Power Monitor Panel from the context menu.
The panel gives you a breakdown of current and power values for
each monitored power line, grouped by destination (daughter
board, peripheral board, User Header). The total power usage in
each group is also given.
In addition to the total power usage across all monitored power
lines for the entire system, the panel also gives a breakdown of:
? Total power usage, per power supply
? Total voltage, per power supply
? Total current drawn, per power supply.
Power Monitoring on the Desktop NanoBoard NB2DSK01
As with the instrument panel, the option to enable/disable polling is provided, as well as the ability to define the polling interval – the period between accessing current measurements from the NanoBoard itself (more specifically, the firmware on the NanoTalk Controller). By default, this value is set to be 1000ms .
Unlike the instrument panel however, if polling is disabled, you can still
manually update the monitored information displayed within the Power
Monitor panel. Remember that polling is simply the automatic retrieval
and update of monitored values. The power monitoring itself – the
hardware on the motherboard – is permanently functional!
Figure 6. Setup power monitoring options as required. Further options are available in the Power Monitor Options dialog
(Figure 6). This dialog can be accessed from both the instrument panel
and the Power Monitor panel, by clicking the Options button.
The dialog provides another place in which to define the polling interval.
It also allows you to specify the voltage that is applied to the User
Headers. This is required if you have not selected either 3.3V or 5V on
the NB2DSK01 itself, through use of jumper placement on the
associated configurable jumper headers for 'User Header A' (JP4)
and 'User Header B' (JP5), respectively.
If you have placed a jumper to select the voltage, the setting in the
dialog should match that selection, in order to gain accurate power
calculations for these lines.
The dialog also offers graphing options. This relates to the graphical
display of power monitoring information, which is considered in the next
section.
Graphical Display of Monitored Information
Display of power monitoring information in tabular format is good, but a visual representation of the values over time is far more engaging and readable. To this end, the power monitoring facility offers the ability to display the monitored information graphically.
All information available in the Power Monitor panel can be enabled for display in a number of charts within Altium Designer's Sim Data Editor. Use the Graphing Options region of the Power Monitor Options dialog (refer back to Figure 6) to enable the charts required.
Graphing itself is only possible provided polling is enabled. Graphing can be
started/stopped in a number of ways:
? From the NanoBoard's Instrument panel – either use the Start Graphing
button (which changes to Stop Graphing button) or the Graphing LED,
to toggle graphing ON/OFF.
? From the Power Monitor panel – use the Enable Graphing option to
toggle graphing ON/OFF.
Once enabled, the monitored data and resulting waveforms will be written to
a Simulation Data File (*.sdf ) and displayed within a multi-tabbed waveform
analysis window – presented in the Sim Data Editor.
Figure 8, on the next page, illustrates graphing of results for a Desktop
NanoBoard that has three peripheral boards and a daughter board attached. As can be seen, each chart is available on a separate tab. The active chart in this case is the Summary chart, which contains two plots. The first plot – entitled Power Summary
– contains waveforms for:
Figure 7. Start graphing the data for the monitored power lines.
? The total power usage for the Desktop NanoBoard system (all 19 monitored power lines), labeled Total
? The total power usage for the daughter board
? The total power usage for Peripheral Board A
? The total power usage for Peripheral Board B
? The total power usage for Peripheral Board C
? The total power usage for the two User Headers
The second plot – entitled Temperature – contains a single waveform for the temperature of the system.
Power Monitoring on the Desktop NanoBoard NB2DSK01
Figure 8. Charts, wave plots and waveforms, all displayed in the integrated Sim Data Editor.
Using the power monitoring facility, you can quickly compare power usages for different hardware configurations on the Desktop NanoBoard. Figures 9 and 10 compare two configurations – with and without peripheral boards attached. In each case, the graphical results focus on the total power consumption across the system, as well as the power consumption and current drawn for each main power rail (1.2V, 1.8V, 2.5V, 3.3V and 5V).
Figure 9. System power and current waveforms – NB2DSK01 with daughter board (DB30) attached only.
Power Monitoring on the Desktop NanoBoard NB2DSK01
Figure 10. System power and current waveforms – NB2DSK01 with daughter board (DB30) and three peripheral boards (PB01, PB02, PB03) attached.
Looking at Figures 9 and 10, we can see that addition of the peripheral boards to the system has increased the total power consumption and that this is due to increased power on the 3.3V and 5V rails. If we had looked across the individual peripheral board waveforms, we would have found that the board plugged into the 'PERIPHERAL BOARD C' connector was indeed responsible for much of the power increase. The board was in fact the PB01 Audio/Video Peripheral Board which, when considering its size and larger number of on-board devices, easily explains the result!
The comparison can be extended to see the effect on power consumption when the physical FPGA device on the daughter board is programmed with a design (Figure 11).
Figure 11. System power and current waveforms – NB2DSK01 with daughter board (DB30) and three peripheral boards (PB01, PB02, PB03) attached. A design has been downloaded into the FPGA device on the daughter board.
Power Monitoring on the Desktop NanoBoard NB2DSK01 The total power consumption for the system has, as expected, increased. This increase is from the extra power consumed by the 3.3V power rail (by the daughter board). Figure 12 shows the jump in daughter board 3.3V power usage at the point where the design is downloaded into the FPGA device.
Figure 12. Increase in 3.3V power consumption at the point where the physical FPGA device on the daughter board is programmed with the design.
The Sim Data Editor provides a wealth of features for waveform manipulation. For example, you can change the display by moving waveforms between plots and between charts. You can change X and Y axes, change the appearance of waveforms, and take measurements – either for a single waveform or between waveforms.
For more information on the workings of the Sim Data Editor and the feature-rich analysis environment it has to offer, refer to the document AP0106 Working with the Sim Data Editor.
For information on the Desktop NanoBoard NB2DSK01, refer to the document TR0143 Technical Reference Manual for Altium's Desktop NanoBoard NB2DSK01.
For information on the complete range of peripheral boards and daughter boards currently available, and additional
documentation specific to each, go to https://www.wendangku.net/doc/cb596538.html,/nanoboard/resources.
Power Monitoring on the Desktop NanoBoard NB2DSK01
Revision History
Date Version No.Revision
release
20-May-2007 1.0 Initial
Software, hardware, documentation and related materials:
Copyright ? 2008 Altium Limited. All Rights Reserved.
The material provided with this notice is subject to various forms of national and international intellectual property protection, including but not limited to copyright protection. You have been granted a non-exclusive license to use such material for the purposes stated in the end-user license agreement governing its use. In no event shall you reverse engineer, decompile, duplicate, distribute, create derivative works from or in any way exploit the material licensed to you except as expressly permitted by the governing agreement. Failure to abide by such restrictions may result in severe civil and criminal penalties, including but not limited to fines and imprisonment. Provided, however, that you are permitted to make one archival copy of said materials for back up purposes only, which archival copy may be accessed and used only in the event that the original copy of the materials is inoperable. Altium, Altium Designer, Board Insight, DXP, Innovation Station, LiveDesign, NanoBoard, NanoTalk, OpenBus, P-CAD, SimCode, Situs, TASKING, and Topological Autorouting and their respective logos are trademarks or registered trademarks of Altium Limited or its subsidiaries. All other registered or unregistered trademarks referenced herein are the property of their respective owners and no trademark rights to the same are claimed. v8.0 31/3/08.