Parameterized Novelty Detection for Environmental Sensor Monitoring
Parameterized Novelty Detection for
Environmental Sensor Monitoring
Cynthia Archer,Todd K.Leen,Antonio Baptista
OGI School of Science&Engineering
Oregon Health&Science University
20000N.W.Walker Road
Beaverton,OR97006
archer@https://www.wendangku.net/doc/3318709382.html,,tleen@https://www.wendangku.net/doc/3318709382.html,,baptista@https://www.wendangku.net/doc/3318709382.html,
Abstract
As part of an environmental observation and forecasting system,
sensors deployed in the Columbia RIver Estuary(CORIE)gather
information on physical dynamics and changes in estuary habi-
tat.Of these,salinity sensors are particularly susceptible to bio-
fouling,which gradually degrades sensor response and corrupts crit-
ical data.Automatic fault detectors have the capability to identify
bio-fouling early and minimize data https://www.wendangku.net/doc/3318709382.html,plicating the devel-
opment of discriminatory classi?ers is the scarcity of bio-fouling
onset examples and the variability of the bio-fouling signature.To
solve these problems,we take a novelty detection approach that
incorporates a parameterized bio-fouling model.These detectors
identify the occurrence of bio-fouling,and its onset time as reliably
as human experts.Real-time detectors installed during the sum-
mer of2001produced no false alarms,yet detected all episodes of
sensor degradation before the?eld sta?scheduled these sensors for
cleaning.From this initial deployment through February2003,our
bio-fouling detectors have essentially doubled the amount of useful
data coming from the CORIE sensors.
1Introduction
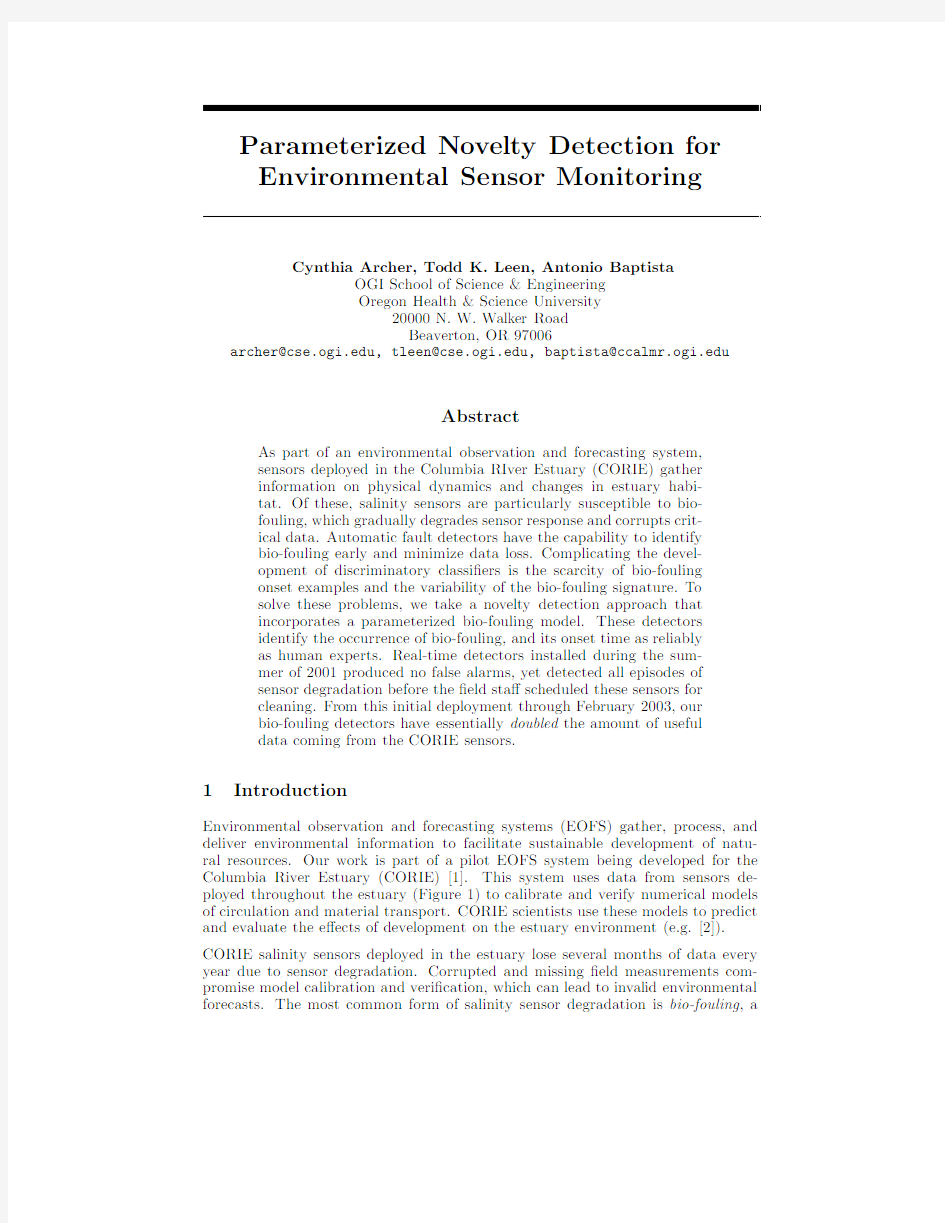
Environmental observation and forecasting systems(EOFS)gather,process,and deliver environmental information to facilitate sustainable development of natu-ral resources.Our work is part of a pilot EOFS system being developed for the Columbia River Estuary(CORIE)[1].This system uses data from sensors de-ployed throughout the estuary(Figure1)to calibrate and verify numerical models of circulation and material transport.CORIE scientists use these models to predict and evaluate the e?ects of development on the estuary environment(e.g.[2]). CORIE salinity sensors deployed in the estuary lose several months of data every year due to sensor degradation.Corrupted and missing?eld measurements com-promise model calibration and veri?cation,which can lead to invalid environmental forecasts.The most common form of salinity sensor degradation is bio-fouling,a
reduction of the sensor response due to growth of biological material on the sensor. Prior the deployment of the technology described here,on a yearly basis CORIE salinity sensors su?ered a68%data loss due to bio-fouling.Although bio-fouling degradation is a common problem for environmental sensors,there is apparently no previous work that develops automatic detectors of such degradation.
Figure1:Map of Columbia River estuary marked with locations of CORIE sensors.
Early bio-fouling detection is made di?cult by the normal variability of salinity measurements.Tides cause the measurements to vary from near river salinity to near ocean salinity twice a day.The temporal pattern of salinity penetration varies spatially in the estuary.In addition,upriver sites,such as AM169,show substantial variability with the14and28day spring-neap tidal cycle.Changes in weather(e.g. winds,precipitation)and ocean conditions cause additional variations in salinity. To complicate bio-fouling detection further,the bio-fouling signature also varies from episode to episode.The time from onset to complete bio-fouling can take anywhere from3weeks to5months depending on the season and type of growth. We observe two types of bio-fouling in the estuary,hard growth(e.g.barnacles) characterized by quick linear degradation and soft growth(e.g.plant material) characterized by slow linear degradation with occasional interruptions in the down-trend.
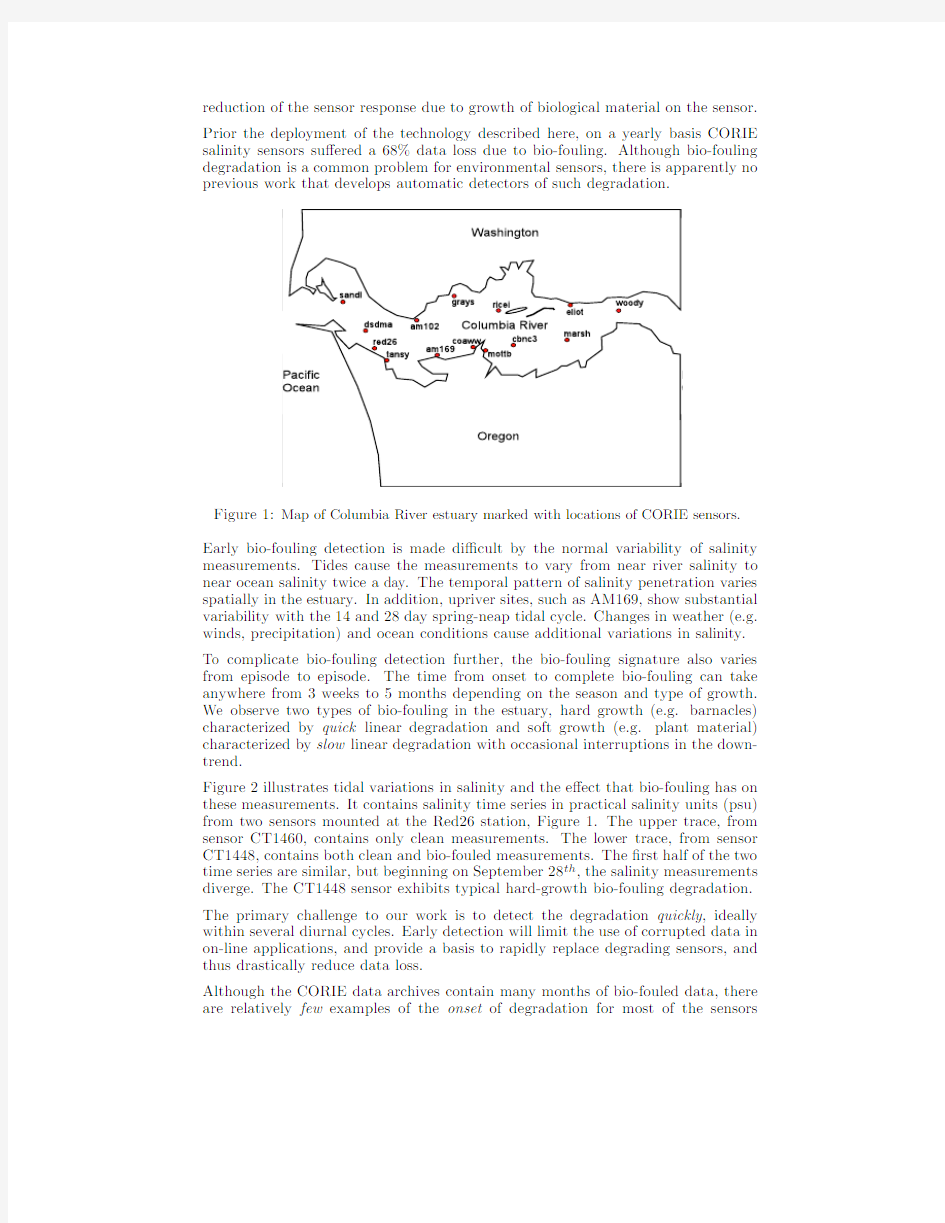
Figure2illustrates tidal variations in salinity and the e?ect that bio-fouling has on these measurements.It contains salinity time series in practical salinity units(psu) from two sensors mounted at the Red26station,Figure1.The upper trace,from sensor CT1460,contains only clean measurements.The lower trace,from sensor CT1448,contains both clean and bio-fouled measurements.The?rst half of the two time series are similar,but beginning on September28th,the salinity measurements diverge.The CT1448sensor exhibits typical hard-growth bio-fouling degradation. The primary challenge to our work is to detect the degradation quickly,ideally within several diurnal cycles.Early detection will limit the use of corrupted data in on-line applications,and provide a basis to rapidly replace degrading sensors,and thus drastically reduce data loss.
Although the CORIE data archives contain many months of bio-fouled data,there are relatively few examples of the onset of degradation for most of the sensors
9/10
9/15
9/20
9/25
9/30
10/05
10/10
0102030C T 1460 s a l i n i t y
Date (month/day)
Figure 2:Clean and bio-fouled salinity time series examples from Red26station.The
upper time series is from clean instrument CT1460.The lower time series from instrument CT1448shows degradation beginning on September 28,2001.On removal,CT1448was found to be bio-fouled.
deployed in the estuary,and it is this onset that we must detect.The dearth of onset examples,and the observed variability of the bio-fouling signature spatially,seasonally,and weekly (according to the spring/neap tidal cycle)prevents use of classical discriminatory fault detectors.Instead we develop a parameterized novelty detector to detect bio-fouling.This detector incorporates a parameterized model of bio-fouling behavior.The parameters in the model of bio-fouled sensor behavior are ?t on-line by maximum-likelihood estimation.A model of the clean sensor behavior is ?t to archival data.These models are used in a sequential likelihood test to provide detection of bio-fouling,and an estimation of the time at which the degradation began.
Evaluations show that our detectors identify the onset of bio-fouling as reliably as human experts,and frequently within fewer tidal cycles of the onset.Our deploy-ment of sensors throughout the estuary has resulted in an actual reduction of the error loss from 68%to 35%.However,this ?gure does not adequately re?ect the e?cacy of the detectors.Were it economical to replace sensors immediately upon detection of degradation,the data loss would have been reduced to 17%.
2Salinity and Temperature
Our detectors monitor maximum diurnal (md)salinity,de?ned as the maximum salinity near one of the two diurnal tidal ?oods.When the sensor is clean,the md salinity stays close to some mean value,with occasional dips of several psu caused by variations in the intrusion of salt water into the estuary.When the sensor bio-fouls,the md salinity gradually decreases to typically less than half its normal mean value,as seen in the Figure 2example.
Detectors that monitor salinity alone can not distinguish between normal decreases
in salinity and early bio-fouling.This results in a high false alarm rate1.Natural salinity decreases can be recognized by monitoring a correlated source of information that is not corrupted by bio-fouling.
Salinity and temperature at a station are products of the same mixing process of ocean and river waters,so we expect these values will be correlated.Assuming linear mixing of ocean and river waters,measured salinity S m and temperature T m are linear functions of ocean{S o,T o}and river{S r,T r}values
S m=α(t)S o+(1?α(t))S r(1)
T m=α(t)T o+(1?α(t))T r(2) whereα(t)is the mixing coe?cient at time t.River salinity S r is close to zero. Consequently,the estimated mixing coe?cient
α(t)=T r?T m
T r?T o
(3)
should be well correlated with salinity,S m≈αS o.The river temperature is mea-sured at far upstream stations(Elliot or Woody).The ocean temperature is esti-mated from measurements at Sand Island,the outermost sensor station.
3Bio-fouling Detection
Our early experiments with single-measurement detection suggested that we develop detectors that accrue information over time-similar to the standard sequential likelihood methods in classical pattern recognition.The is a natural framework for detecting degradation that grows with time.
Assume a sequence of measurements(salinity and temperature)y n,n=1,...,N where N is the current time.We construct probability densities for such sequences for both clean sensors p(y1,...,y N|c),and for biofouled sensors p(y1,...,y N|f). With these distributions,we construct a likelihood ratio test
h=ln p(y1,...,y N|f)
p(y1,...,y N|c)
f
>
<
c
λ(4)
where the thresholdλis chosen high enough to provide a speci?ed false alarm rate (Neyman-Pearson test).
We assume that the probability density for the measurement sequence for fouled detectors is parameterized by a vector of unknown parametersθ.The model is constructed such that atθ=0the density for the sequence assuming a fouled detector is equal to the density of the sequence assuming a clean detector
p(y1,...,y N|f,θ=0)=p(y1,...,y N|c)(5)
Next,we suppose that a given sequence contains a bio-fouling event that is initiated at the unknown timeτ.Under our density models(below),consecutive measure-ments in the sequence are independent conditioned on the state of the detector.
1Equivalently,if the alarm threshold is increased to maintain a low false alarm rate, the rate of proper detections is decreased.
Consequently,the likelihood ratio for the sequence(4)reduces to
h=ln p(y1,...,y N|f,τ,θ)
1N
=ln
p(y1,...,yτ?1|c)p(yτ,...,y N|τ,θ,f)
1N
=
N
n=τln p(y n|τ,θ,f)
p(y n|c)
f
>
<
c
λ(6)
Finally,we?t the fouling model parametersθand the onset timeτ,by maximizing the log-likelihood ln p(y1,...,y N|f,τ,θ)with respect toθandτ.Since the clean detector model is independent ofτandθ,this is equivalent to maximizing the log-likelihood ratio in(6).Hence,we replace the latter with
h=max
τ,θ
N
n=τln p(y n|τ,θ,f)
p(y n|c)
f
>
<
c
λ(7)
If the sequence is coming from a clean sensor,the?t should giveθ≈0and hence h≈0(cf5),and we will detect no event(assumingλ>0).This construction is a variant of the type of signal change detection discussed by Basseville[3].
3.1Bio-fouling Fault Model
By parameterizing the bio-fouling model,we are able to develop detectors using only clean example data.In this parameterized novelty detector,the bio-fouled parametersθare?t on-line to the data under test.To develop our classi?er,we ?rst de?ne models of the clean and bio-fouled data.We model the true salinity,s, and temperature-based mixing coe?cient,α,as jointly Gaussian,
p(s,α|c)=N(μ,Σ)whereμ= μsμα andΣ= σ2sσsα
σsασ2α .(8) This provides a regression of the salinity onα.The probability of md salinity mea-surement conditioned on temperature when the sensor is clean is Gaussian N(η,ρ2), with conditional mean
E[s|α,c]≡η=μs+(σsα/σ2α)(α?μα)(9) and conditional variance
var[s|α,c]≡ρ2=σ2s?σ2sα/σ2α(10)
When bio-fouling occurs,the salinity measurement is suppressed relative to the true value.We model this suppression as a linear downtrend with(unknown)rate (slope)m that begins at(unknown)timeτ.The model of the measured md salinity value for a fouled detector is
x n=g(n)s n(11) where the suppression factor,g(n),is
g(n)= 1n<τ
(1?m(n?τ))n≥τ(12) and m is the bio-fouling rate(1/sec).Using this suppression factor g(n)(12),the probability of the salinity measurement,x,conditioned on temperature is
p(x n|αn,m,τ,f)=N(g(n)ηn,g2(n)ρ2)(13)
Note that since the temperature sensor is not susceptible to bio-fouling,we need not consider the case of both sensors degrading at the same time.
The discriminant function in(7)depends on the parameters of the clean model(9) and(10)which are estimated from historical data.It also depends on the slope parameterθ=m of the fouling model,and the onset timeτwhich are?t online as per(7).
Applying our Gaussian models in(8)and13)to(7)gives us
h=max
τ,m
N
n=τln11?m(n?τ)+(x n?ηn)22ρ?(x n?(1?m(n?τ))ηn)2
2(1?m(n?τ))ρ
(14)
When h is above our chosen threshold,the detector signals a biofouled sensor.The thresholdλis set to provide a maximum false alarm rate on historical data.
3.2Model Fitting
We?nd maximum likelihood estimates forμandΣfrom clean archival time series data.For y n=[s n,αn]T and N training values,the mean is given byμ=1
N n y n and the covariance matrix byΣ=1 n(y n?μ)(y n?μ)T.All other classi?er parameter values,such asμs or E[s|α],can be extracted or calculated fromμand Σ.
At each time step N,we determine the maximum likelihood estimate of onset time τand bio-fouling rate m from the data under test.We?nd the maximum likelihood estimate of bio-fouling rate m,for some onset timeτ,by setting the?rst derivative of(14)with respect to m equal to zero.This operation yields the relation
m
N
k=τ+1(k?τ)2ωkη2k=N k=τ+1k?τωk (x k?ηk)ηkωk?ρ2+(x k?ωkηk)2
ω
k
(15)
whereωk=1?m(k?τ)and N is the current time.Note that m appears both at the beginning of(15)and in the de?nition ofω,so we do not have a closed form solution for m.However,theωvalues act as weights that increase the importance of most recent measurements.This weighting accounts for the expected decrease in measurement variance as bio-fouling progresses.To estimate m we take an iterative approach.First,initialize m to its minimum mean-squared error value given by
m(0)=? N k=τ+1(k?τ)(x k?ηk)ηk
k=τ+1(k?τ)2η2k(16) Second,repeatedly solve(15)for m(i)withωcalculated using the previous value m(i?1).The estimated rate value stops changing when h reaches a maximum.
If we set the window length N?k to maximize the log likelihood ratio,h,the best estimate of onset time isτ.To determine the onset time estimate,τ,we search over over all past time for the value of k that maximizes h(14).For each possible window length,that is k=3...N,we determine the maximum likelihood estimate for m and then calculate the corresponding discriminant h.The estimated onset timeτis the window length N?k that gives the largest value of h.If this h is above our threshold,the current measurement is classi?ed as bio-fouled.
4On-line Bio-fouling Detectors
To see how well our classi?ers worked in practice,we implemented versions that op-erated on real-time salinity and temperature measurements.For all four instances
of sensor degradation(three bio-fouling incidents and one instrument failure that mimicked bio-fouling)that occurred in the summer2001test period,our classi?ers correctly indicated a sensor problem before the?eld sta?was aware of it.In ad-dition,the real-time classi?ers produced no false alarms during the summer test period.More in-depth discussion of the detector suite is given by Archer et al in [4].
(a)Red26(b)Tansy Point
Figure3:Bio-fouling Indicators Red26and Tansy Point.Top plots show maximum diurnal salinity.Dotted lines indicate historical no false alarm(lower)and10%false alarm rate(upper).Field sta?schedule sensors for cleaning when the maximum salinity drops“too low”,roughly the no false alarm level.Bottom plots show the sequential likelihood discriminant for forty days of salinity and temperature measurements.Dotted lines indicate historical no false alarm(upper)and10%false alarm rate(lower).The×indicates the estimated bio-fouling onset time.
The on-line monitor displays a bio-fouling indicator for the previous forty days of data.Figure3shows the on-line bio-fouling monitor during incidents at the Red26 CT1448sensor and the Tansy Point CT1462sensor.Since we had another sensor mounted at the Red26site that did not bio-foul,Figure2,we were able to estimate the bio-fouling time as September28th.Our detector discriminant passed the no false alarm threshold?ve days after onset and roughly three days before the?eld sta?decided the instrument needed cleaning.This reduction in time to detection corresponds to reduced data loss of over30%.In addition,the onset time estimate of September29th was within a day of the true onset time.
The Tansy Point CT1462sensor began to bio-foul a few days after the Red26 CT1448sensor.Our detector indicated that the Tansy Point sensor was bio-fouling on October9th.Since neighboring sensor Red26was being replaced on October 11th,the?eld sta?decided to retrieve the Tansy Point sensor as well.On removal, this sensor was found to be in the early stages of bio-fouling.In this case,indications from our classi?er permitted the sensor to be replaced before the?eld sta?would normally have scheduled it for retrieval.Experience with our on-line bio-fouling indicators demonstrates that these methods substantially reduce time from bio-fouling onset to detection.
In addition to the events described above,we have fairly extensive experience with the online detectors since their initial deployment in the Spring of2001.At this writing we have bio-fouling detectors at all observing stations in the estuary and experience with events throughout the year.Near the end of October,2001we experienced a false alarm in a sensor near the surface in the lower estuary.In this case,a steady downward trend in surface salinity,caused by several days of
rain triggered a detector response.Following cessation of the precipitation,the discriminant function h returned back to sub-threshold levels.
In a recent(February2003)study of?ve sensor stations in the estuary we compared data loss prior to the deployment of bio-fouling detectors,with data loss post-deployment.The pre-deployment period included approximately four years of data from1997through the summer of2001.The post-deployment period ran from spring/summer of2001through February2003.
Neglecting seasonal variation,prior to the deployment of our detectors,68%of all the sensor data was corrupted by bio-fouling.Following deployment,the rate of data loss due to bio-fouling dropped to35%.This is the actual data loss,and includes delay in responding to the event detection.Were it economical to replace the sensors immediately upon detection of bio-fouling,the data loss rate would have been dropped farther to17%.Even with the delay in responding to event detection, the detectors have more than doubled the amount of reliable data collected from the estuary.
5Discussion
CORIE salinity sensors lose several months of data every year due to sensor bio-fouling.Developing discriminatory fault detectors for these sensors is hampered by the variability of the bio-fouling time-signature,and the dearth of bio-fouling onset example data for training.To solve this problem,we built parameterized novelty detectors.Clean sensor models were developed based on archive data,while bio-fouled sensor models are given a simple parametric form that is?t online.On-line bio-fouling detectors deployed during the summer of2001detected all episodes of sensor degradation several days before the?eld sta?without generating any false alarms.Expanded installation of a suite of detectors throughout the estuary continue to successfully detect bio-fouling with minimal false alarm intrusion.The detector deployment has e?ectively doubled the amount of clean data available from the estuary salinity sensors.
Acknowledgements
We thank members of the CORIE team,Arun Chawla and Charles Seaton,for their help in acquiring appropriate sensor data,Michael Wilkin for his assistance in labeling the sensor data,and Haiming Zheng for carrying forward the sensor development and deployment and providing the comparison of data loss rates before and after the detector deployment..This work was supported by the National Science Foundation under grants ECS-9976452and CCR-0082736. References
[1] A.Baptista,M.Wilkin,P.Pearson,P.Turner,C.McCandlish,and P.Barrett.Costal
and estuarine forecast systems:A multipurpose infrastructure for the Columbia river.
Earth System Monitor,9(3),1999.
[2]U.S.Army Corps of Engineers.Biological asssessment-Columbia river channel im-
provements project.Technical report,USACE Portland District,December2001. [3]M.Basseville.Detecting changes in signals and systems-a survey.Automatica,
24(3):309–326,1988.
[4] C.Archer,A.Baptista,and T.K.Leen.Fault detection for salinity sensors in the
Columbia River Estuary.Water Resources Research,39,2003.